> ## Documentation Index
> Fetch the complete documentation index at: https://docs.kubex.ai/llms.txt
> Use this file to discover all available pages before exploring further.

# Cloud Instance Overview

export const InlineImageWithText = ({src, href, children, width = 80, caption}) => {
  return <span className="inline-flex items-center gap-3 align-middle">
            <a href={href} className="inline-block border-b-0">
                <Frame caption={caption}>
                    <img src={src} alt="" className="object-contain align-middle " width={width} style={{
    minWidth: width
  }} />
                </Frame>
            </a>
            <span className="align-middle">{children}</span>
        </span>;
};

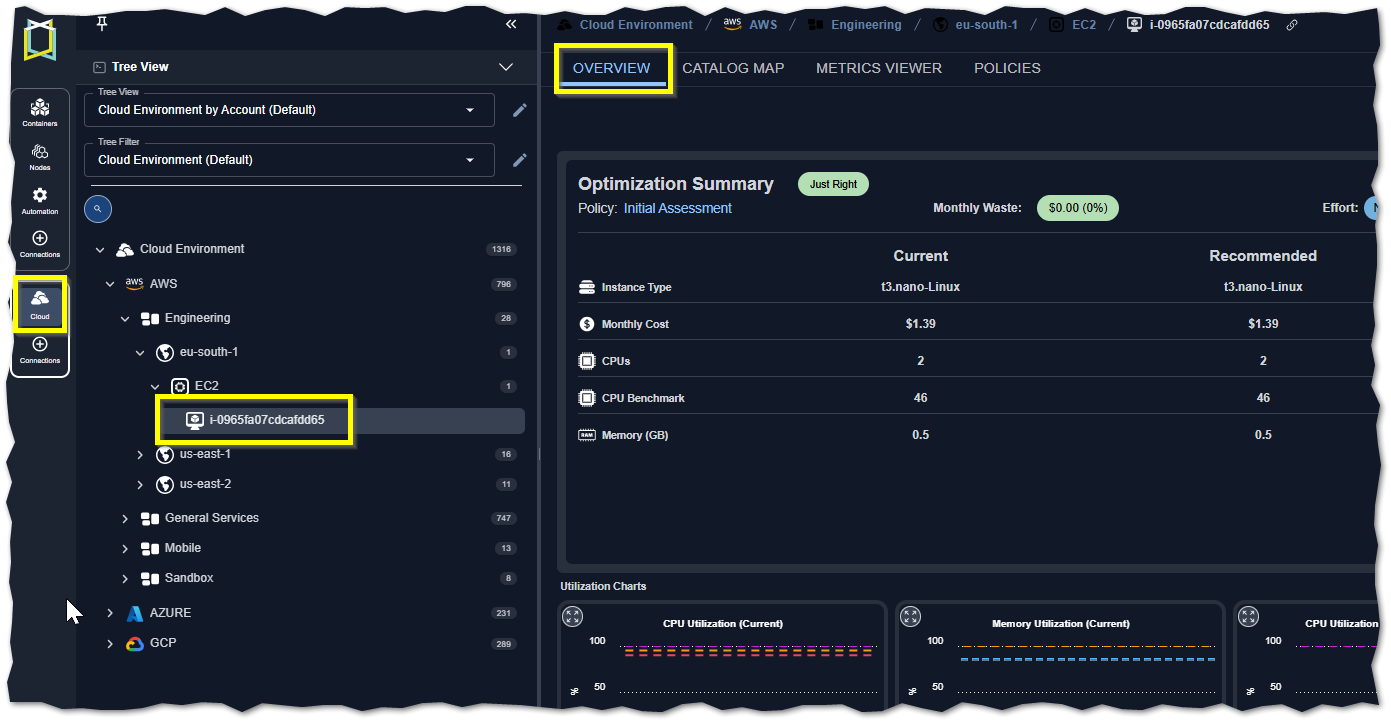
The cards on this tab provide a visual overview of a single instance. When navigating the [tree viewer](/docs-kubex/Content/Kubex/Using_the_Tree_Viewer), you will see this tab when a single scale set or instance is selected.

<Frame caption="Figure: Locating the Overview Tab">
  <img src="https://mintcdn.com/densify/PbuHR0XRoCgbSmr4/images/docs-kubex/Content/Cloudex/03000008_662x327.png?fit=max&auto=format&n=PbuHR0XRoCgbSmr4&q=85&s=ed77b88b287328b5dd0eaeb9eecabe6f" alt="" width="1391" height="722" data-path="images/docs-kubex/Content/Cloudex/03000008_662x327.png" />
</Frame>

You will also see a popup of this page when you click the "System Name" hyperlink in the [Analysis Details](/docs-kubex/Content/Kubex/AI_Analysis_Details_Table#hyperlink) tab.

### Impact Analysis and Recommendation Report

The Impact Analysis and Recommendation report provides a PDF version of the instance details. You can easily share this report with the application owner to share your proposed sizing recommendations.

You can also share the link.

<div style={{ width: "100%", display:"flex", flexDirection:"row", alignItems:"center", gap: "6px" }}>
  <div>
    <Frame caption="Figure: Generating the Report">
      <img src="https://mintcdn.com/densify/nLYqHgk8d7rz4lmT/images/docs-kubex/Content/Cloudex/03000026_304x121.png?fit=max&auto=format&n=nLYqHgk8d7rz4lmT&q=85&s=11c227aa7d07ab7fc424da866ee225e3" style={{width: "304",height: "121"}} width="304" height="121" data-path="images/docs-kubex/Content/Cloudex/03000026_304x121.png" />
    </Frame>

    <Frame caption="Figure: Downloading the PDF">
      <img src="https://mintcdn.com/densify/nLYqHgk8d7rz4lmT/images/docs-kubex/Content/Cloudex/03000027_304x121.png?fit=max&auto=format&n=nLYqHgk8d7rz4lmT&q=85&s=778cb2c53cb6bd620d0c9ade26220ab3" style={{width: "304",height: "121"}} width="304" height="121" data-path="images/docs-kubex/Content/Cloudex/03000027_304x121.png" />
    </Frame>
  </div>

  <div>
    <Note>
      Note:  This report is not available for Azure VM Scale Sets.
    </Note>

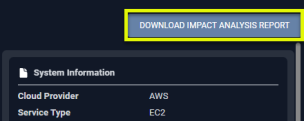
    Click the link in the upper corner to download a PDF version of the Impact Analysis and Recommendation Report.

    <br />

    <br />

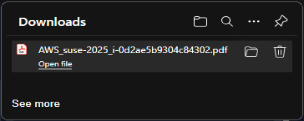
    When you click the button, a popup opens with a link. You can save or download the file.

    <br />

    <br />

    The filename will be `<cloud provider>_<system name>_<system_id>.pdf`
  </div>
</div>

You also have access to the [metrics viewer](/docs-kubex/Content/Kubex/Metrics_Viewer_Tab) when a single container is selected.

### Optimization Summary

Hover over any of the listed items to see a brief description. Complete descriptions of each setting are provided in the [Analysis Details Table](/docs-kubex/Content/Cloudex/AI_Analysis_Details_Table-Cloud).

### Optimization Summary - Single VM Instances

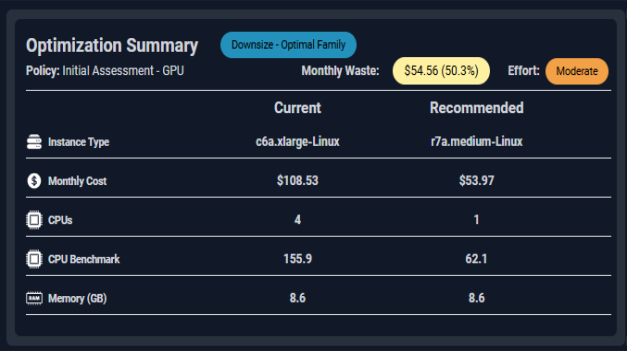
Instance details and key metrics are displayed for the current and recommended instance types.
<div style={{ width: "100%", display:"flex", flexDirection:"row", alignItems:"center" }}>
  <Frame caption="Figure: Optimization Summary - Single VM Instance">
    <img src="https://mintcdn.com/densify/nLYqHgk8d7rz4lmT/images/docs-kubex/Content/Cloudex/03000014_627x351.png?fit=max&auto=format&n=nLYqHgk8d7rz4lmT&q=85&s=7b0b85433c294123c37c789c1dbcdffa" style={{width: "304",height: "121"}} width="627" height="351" data-path="images/docs-kubex/Content/Cloudex/03000014_627x351.png" />
  </Frame>

  <ul style={{width: "50%"}}>
    <li>
      <Tooltip tip="The current instance type, based on data collection and the recommended instance type based on the Kubex analysis.">Instance Type</Tooltip>
    </li>

    <li>
      <Tooltip tip="This is the per instance cost per month, for the current instance type, corresponding to the listed Catalog Instance type for on-demand usage. The second column contains the same value, for the recommended instance type.">
        Monthly Cost
      </Tooltip>
    </li>

    <li>
      <Tooltip tip="The current CPU allocation, based on data collection and the recommended value based on the Kubex analysis.">CPU</Tooltip>
    </li>

    <li>
      <Tooltip tip="The CPU benchmark for the current instance type and for the recommended instance type.">CPU Benchmark</Tooltip>
    </li>

    <li>
      <Tooltip tip="The current memory allocation, based on data collection and the recommended value based on the Kubex analysis.">Memory</Tooltip>
    </li>
  </ul>
</div>

### Optimization Summary Block - Single Scale Set

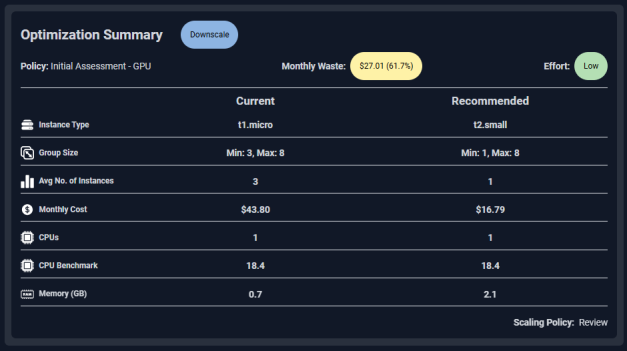
Instance details and key metrics are displayed for the current and recommended instance types for a scale set.

<div style={{ width: "100%", display:"flex", flexDirection:"row", alignItems:"center" }}>
  <Frame caption="Figure: Optimization Summary - Single Instance">
    <img src="https://mintcdn.com/densify/nLYqHgk8d7rz4lmT/images/docs-kubex/Content/Cloudex/03000010_627x351.png?fit=max&auto=format&n=nLYqHgk8d7rz4lmT&q=85&s=cdcfa9bf0b78700024fc36d90e304229" style={{width: "304",height: "121"}} width="627" height="351" data-path="images/docs-kubex/Content/Cloudex/03000010_627x351.png" />
  </Frame>

  <ul style={{width: "50%"}}>
    <li>
      <Tooltip tip="The specified optimization type of this instance.  i.e. Downsize, Upsize, etc.">
        Optimization Summary
      </Tooltip>
    </li>

    <li>
      <Tooltip tip="The policy used to analyze the data and generate the recommendations">
        Policy
      </Tooltip>
    </li>

    <li>
      <Tooltip tip="Calculated as: (current estimated cost - recommended estimated cost).">
        Monthly Waste
      </Tooltip>
    </li>

    <li>
      <Tooltip tip="The effort required to investigate and implement this recommendation.">
        Effort
      </Tooltip>
    </li>

    <li>
      <Tooltip tip="The current instance type, based on data collection and the recommended instance type based on the Kubex analysis.">
        Instance Type
      </Tooltip>
    </li>

    <li>
      <Tooltip tip="The current and recommended number of instances for the selected scale group.">
        Group Size
      </Tooltip>
    </li>

    <li>
      <Tooltip tip="The average instance count when the scale group is running for the current and recommended ASG.">
        Avg No. of Instances
      </Tooltip>
    </li>

    <li>
      <Tooltip tip="This is the per instance cost per month, for the current instance type, corresponding to the listed Catalog Instance type for on-demand usage. The second column contains the same value, for the recommended instance type.">
        Monthly Cost
      </Tooltip>
    </li>

    <li>
      <Tooltip tip="The current CPU allocation, based on data collection and the recommended value based on the Kubex analysis.">
        CPU
      </Tooltip>
    </li>

    <li>
      <Tooltip tip="The CPU benchmark for the current instance type and for the recommended instance type.">
        CPU Benchmark
      </Tooltip>
    </li>

    <li>
      <Tooltip tip="The current memory allocation, based on data collection and the recommended value based on the Kubex analysis.">
        Memory
      </Tooltip>
    </li>
  </ul>
</div>

## System Details

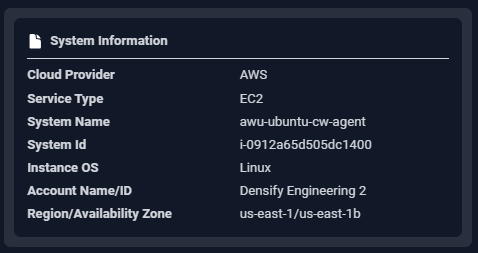
This card summarizes the identification details for the selected instance. The same details are provided for a single VM or scale set.

<div style={{ width: "100%", display:"flex", flexDirection:"row", alignItems:"center" }}>
  <Frame caption="Figure: System Details">
    <img src="https://mintcdn.com/densify/nLYqHgk8d7rz4lmT/images/docs-kubex/Content/Cloudex/03000015.png?fit=max&auto=format&n=nLYqHgk8d7rz4lmT&q=85&s=8206fa2b8e5ffdfef5bb60d4ecc41a57" style={{width: "304",height: "121"}} width="478" height="253" data-path="images/docs-kubex/Content/Cloudex/03000015.png" />
  </Frame>

  <ul style={{width: "50%"}}>
    <li>
      <Tooltip tip="The name of the public cloud provider.">
        Cloud Provider
      </Tooltip>
    </li>

    <li>
      <Tooltip
        tip="The type of service being analyzed. One of the following:
*AWS EC2, RDS and ASGs
*Azure VM and VM Scale Sets
*GCP Compute Instances
Not all service types are supported."
      >
        Service Type
      </Tooltip>
    </li>

    <li>
      <Tooltip tip="The name of the selected system.">
        System Name
      </Tooltip>
    </li>

    <li>
      <Tooltip tip="A unique key assigned by the public cloud vendors to identify this instance. This value is not the same as the Entity ID which is a Kubex ID.">
        System ID
      </Tooltip>
    </li>

    <li>
      <Tooltip tip="The operating system running on this instance.">
        Instance OS
      </Tooltip>
    </li>

    <li>
      <Tooltip
        tip="The type of service being analyzed. One of the following:
*AWS EC2, RDS and ASGs
*Azure VM and VM Scale Sets
*GCP Compute Instances
Not all service types are supported."
      >
        Service Type
      </Tooltip>
    </li>

    <li>
      <Tooltip tip="The name of the selected system.">
        System Name
      </Tooltip>
    </li>

    <li>
      <Tooltip tip="A unique key assigned by the public cloud vendors to identify this instance. This value is not the same as the Entity ID which is a Kubex ID.">
        System ID
      </Tooltip>
    </li>

    <li>
      <Tooltip tip="The operating system running on this instance.">
        Instance OS
      </Tooltip>
    </li>

    <li>
      <Tooltip
        tip="One of Account Name or Account ID:
* Account Name - The instance's parent account, corresponding to: AWS Linked Account, Azure Subscription or GCP Project.
* Account ID - A unique key assigned by the public cloud vendors to identify the account."
      >
        Account Name/ID
      </Tooltip>
    </li>

    <li>
      <Tooltip tip="The region, in which this instance is located, or the availability zone that corresponds to a geographic region.">
        Region/Availability Zone
      </Tooltip>
    </li>
  </ul>
</div>

## Status Overview

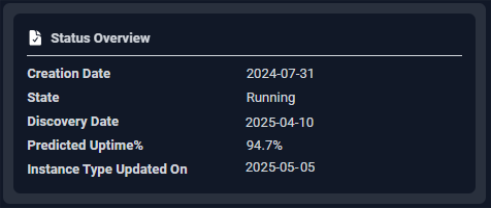
This card summarizes the status of this instance within Kubex.

<div style={{ width: "100%", display:"flex", flexDirection:"row", alignItems:"center" }}>
  <Frame caption="Figure: Status Overview">
    <img src="https://mintcdn.com/densify/nLYqHgk8d7rz4lmT/images/docs-kubex/Content/Cloudex/03000016_491x208.png?fit=max&auto=format&n=nLYqHgk8d7rz4lmT&q=85&s=0eabb9cd1762e5b69cefc8416e0cdac4" style={{width: "304",height: "121"}} width="491" height="208" data-path="images/docs-kubex/Content/Cloudex/03000016_491x208.png" />
  </Frame>

  <ul style={{width: "50%"}}>
    <li>
      <Tooltip tip="The date on which this instance was created in your public cloud account.">
        Creation Date
      </Tooltip>
    </li>

    <li>
      <Tooltip tip="The power state of the selected instance.">
        State
      </Tooltip>
    </li>

    <li>
      <Tooltip tip="The date on which this instance, was first created in your public cloud account.">
        Discovery Date
      </Tooltip>
    </li>

    <li>
      <Tooltip tip="The predicted uptime (%) for a cloud instance or container, is based on the percentage of hours CPU utilization data is present in the historical interval, as specified in the policy settings for the entity. For ASGs and VMSSs, individual child instances are not taken into account. See Analysis Details Table for details.">
        Predicted Uptime %
      </Tooltip>
    </li>

    <li>
      <Tooltip tip="A value in this column indicates that the instance type was changed recently. The recommendation for this instance is based only on workload data collected from the specified date, onward. Any historical data gathered before this date is excluded from the analysis, as it has been collected from a different instance type and is no longer relevant.">
        Instance Type Updated On
      </Tooltip>
    </li>
  </ul>
</div>

## Utilization Charts

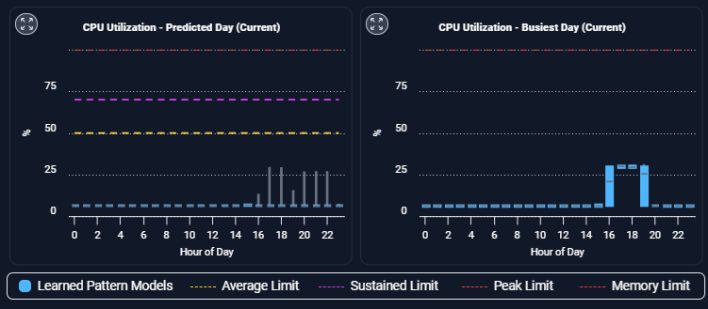
The bottom section shows the utilization charts for the selected instance. These charts show hourly min/max and sustained activity for the selected system. The charts show the current and the recommended settings for selected workloads. If the selected instance is "Just Right" then there are no charts for the recommended instance type.

See [Analysis Details Utilization Charts](/docs-kubex/Content/Kubex/AI_Analysis_Details_Charts) for details on using these charts to review workload data.

<Frame caption="Figure: Utilization Charts">
  <img src="https://mintcdn.com/densify/nLYqHgk8d7rz4lmT/images/docs-kubex/Content/Cloudex/03000017_708x309.png?fit=max&auto=format&n=nLYqHgk8d7rz4lmT&q=85&s=a6766688a0597cd5586afdad13384928" alt="" width="708" height="309" data-path="images/docs-kubex/Content/Cloudex/03000017_708x309.png" />
</Frame>

<div style={{ width: "100%", display:"flex", flexDirection:"row", alignItems:"center" }}>
  <ul style={{width: "50%"}}>
    <li>
      CPU Utilization (

      <Tooltip tip="When Kubex collects data and reports on it, the results are based on a ‘predicted’ day's data generated using Densify's patented analytics. This is not the average over a set sampling period, but the result of the analysis and your policy settings. Most importantly, it is based on the system's predicted modeled behavior. This is the Kubex machine learning.">
        Predicted Day
      </Tooltip>

      )
    </li>

    <li>CPU Utilization - Busiest Day</li>
    <li>Memory Utilization</li>
  </ul>

  <ul style={{width: "50%"}}>
    <li>In Service Instances (for ASG and VMSS only)</li>
    <li>Network I/O Bytes</li>
    <li>Network I/O Packets</li>
  </ul>
</div>

### Expanded Modal View

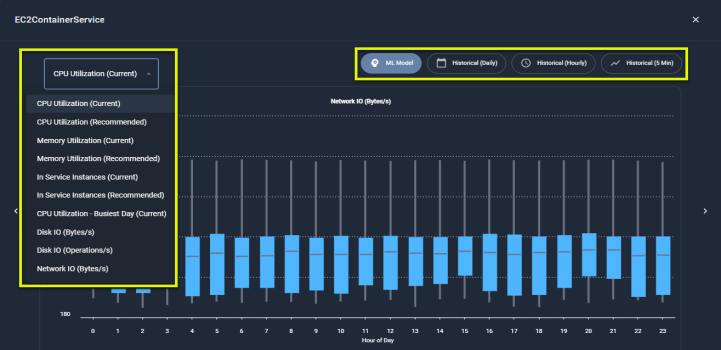
You can also expand any chart to the modal view and select from the following options for review.

<InlineImageWithText src="/images/docs-kubex/Content/Cloudex/03000038_45x43.png">
  Clicking the zoom button opens the chart in a modal view with additional options to view the collected and analyzed data.
</InlineImageWithText>

<Frame caption="Figure: Chart Modal View">
  <img src="https://mintcdn.com/densify/nLYqHgk8d7rz4lmT/images/docs-kubex/Content/Cloudex/03000025_721x350.png?fit=max&auto=format&n=nLYqHgk8d7rz4lmT&q=85&s=892d0963f5b150d5d16c1258dd0de960" alt="" width="721" height="350" data-path="images/docs-kubex/Content/Cloudex/03000025_721x350.png" />
</Frame>

The following options allow you to view all details of your data:

<div style={{ width: "50%", display:"flex", flexDirection:"row", alignItems:"center" }}>
  <ul style={{width: "50%"}}>
    <li>
      <Tooltip tip="The data is aggregated hourly for the last day (yesterday) and displayed using quartile data.">
        ML Model
      </Tooltip>
    </li>

    <li>
      <Tooltip tip="The instance data, is aggregated for a single day. You can see the minimum, maximum, sustained and average values by clicking on any data point. Use the slider at the bottom to select the historical days of data to review. Up to 90 days of data is retained.">
        Historical Daily
      </Tooltip>
    </li>
  </ul>

  <ul style={{width: "50%"}}>
    <li>
      <Tooltip tip="The instance data, aggregated for a single hour. Like the historical daily view, you can see the minimum, maximum, sustained and average values by clicking on any data point. Use the slider at the bottom to select the range of data to view.">
        Historical Hourly
      </Tooltip>
    </li>

    <li>
      <Tooltip tip="The container's data aggregated into 5-minute  samples. This option is available for CPU, Working Set Memory, RSS Memory, Total Memory, and Restarts.">
        Historical (5 Min)
      </Tooltip>
    </li>
  </ul>
</div>

#### Video Resources

<AccordionGroup>
  <Accordion title="Using the Tree Viewer">
    <iframe frameborder="0" height="310" src="https://player.vimeo.com/video/1038945637?title=0&byline=0&portrait=0&badge=0&autopause=0&player_id=0&app_id=58479" width="550" />

    <a href="https://player.vimeo.com/video/1038945637?title=0&byline=0&portrait=0&badge=0&autopause=0&player_id=0&app_id=58479" target="_blank">Using the Tree Viewer</a>
  </Accordion>

  <Accordion title="Using the Utilization Charts">
    <iframe frameborder="0" height="310" src="https://player.vimeo.com/video/1042992591?badge=0&autopause=0&player_id=0&app_id=58479" width="550" />

    <a href="https://player.vimeo.com/video/1042992591?badge=0&autopause=0&player_id=0&app_id=58479" target="_blank">Using the Utilization Charts</a>
  </Accordion>
</AccordionGroup>