> ## Documentation Index
> Fetch the complete documentation index at: https://docs.kubex.ai/llms.txt
> Use this file to discover all available pages before exploring further.
# K8s Dashboards
## Overview Dashboard
The Kubernetes Overview brings key optimization outcomes together in one place:
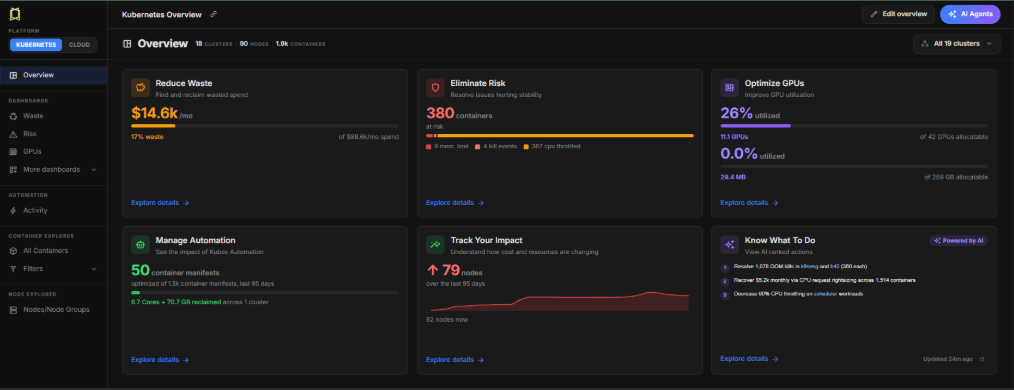 * **Reduce Waste** - Identify wasted spend and opportunities to improve resource efficiency.
* **Eliminate Risk** - Quickly surface container and node risks that could impact workload stability.
* **Optimize GPUs** - Understand GPU allocation, utilization, and optimization opportunities.
* **Manage Automation** - See how Kubex Automation is continuously optimizing your workloads.
* **Track Your Impact** - Understand how your Kubernetes footprint and costs are changing.
* **Know What To Do** - Use AI-ranked actions to identify where to focus next.
## Understand Where You Can Reduce Waste
* **Reduce Waste** - Identify wasted spend and opportunities to improve resource efficiency.
* **Eliminate Risk** - Quickly surface container and node risks that could impact workload stability.
* **Optimize GPUs** - Understand GPU allocation, utilization, and optimization opportunities.
* **Manage Automation** - See how Kubex Automation is continuously optimizing your workloads.
* **Track Your Impact** - Understand how your Kubernetes footprint and costs are changing.
* **Know What To Do** - Use AI-ranked actions to identify where to focus next.
## Understand Where You Can Reduce Waste
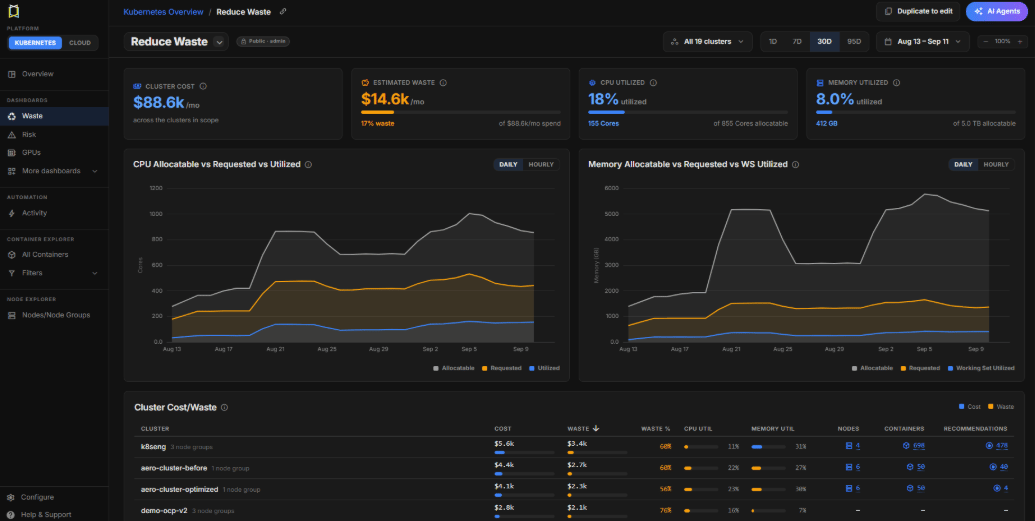 The Reduce Waste dashboard connects cost and resource utilization in a single view. See estimated waste alongside CPU and memory allocation and utilization, then drill down by cluster to identify where the biggest opportunities exist.
## Identify and Address Operational Risk
The Reduce Waste dashboard connects cost and resource utilization in a single view. See estimated waste alongside CPU and memory allocation and utilization, then drill down by cluster to identify where the biggest opportunities exist.
## Identify and Address Operational Risk
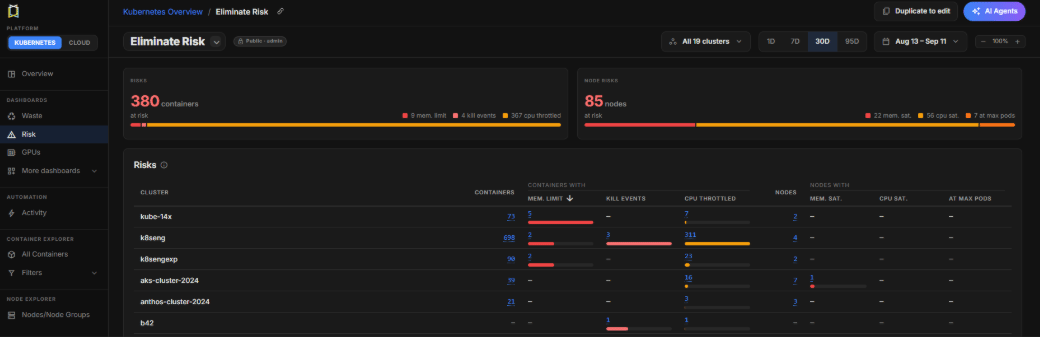 The Eliminate Risk dashboard provides a consolidated view of potential workload and infrastructure risks across your Kubernetes environment, including memory limit events, kill events, CPU throttling, and node CPU and memory saturation.
## Measure the Impact of Automation
The Eliminate Risk dashboard provides a consolidated view of potential workload and infrastructure risks across your Kubernetes environment, including memory limit events, kill events, CPU throttling, and node CPU and memory saturation.
## Measure the Impact of Automation
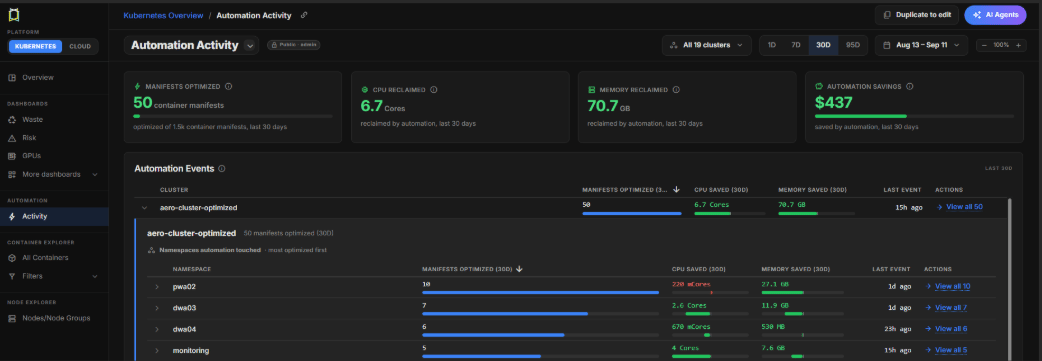 Automation is a core part of the new Kubex experience.
The Automation Activity dashboard makes it easy to see the impact Kubex Automation is having across your environment. Track the number of container manifests optimized, CPU and memory reclaimed, estimated savings, and recent automation activity, all in one place.
This gives your teams a clear view not only of where Kubex identifies optimization opportunities, but also of what has actually been optimized and the value delivered through automation.
Automation is a core part of the new Kubex experience.
The Automation Activity dashboard makes it easy to see the impact Kubex Automation is having across your environment. Track the number of container manifests optimized, CPU and memory reclaimed, estimated savings, and recent automation activity, all in one place.
This gives your teams a clear view not only of where Kubex identifies optimization opportunities, but also of what has actually been optimized and the value delivered through automation.