> ## Documentation Index
> Fetch the complete documentation index at: https://docs.kubex.ai/llms.txt
> Use this file to discover all available pages before exploring further.

# Nodes Tab

export const InlineImageWithText = ({src, href, children, width = 80, caption}) => {
  return <span className="inline-flex items-center gap-3 align-middle">
            <a href={href} className="inline-block border-b-0">
                <Frame caption={caption}>
                    <img src={src} alt="" className="object-contain align-middle " width={width} style={{
    minWidth: width
  }} />
                </Frame>
            </a>
            <span className="align-middle">{children}</span>
        </span>;
};

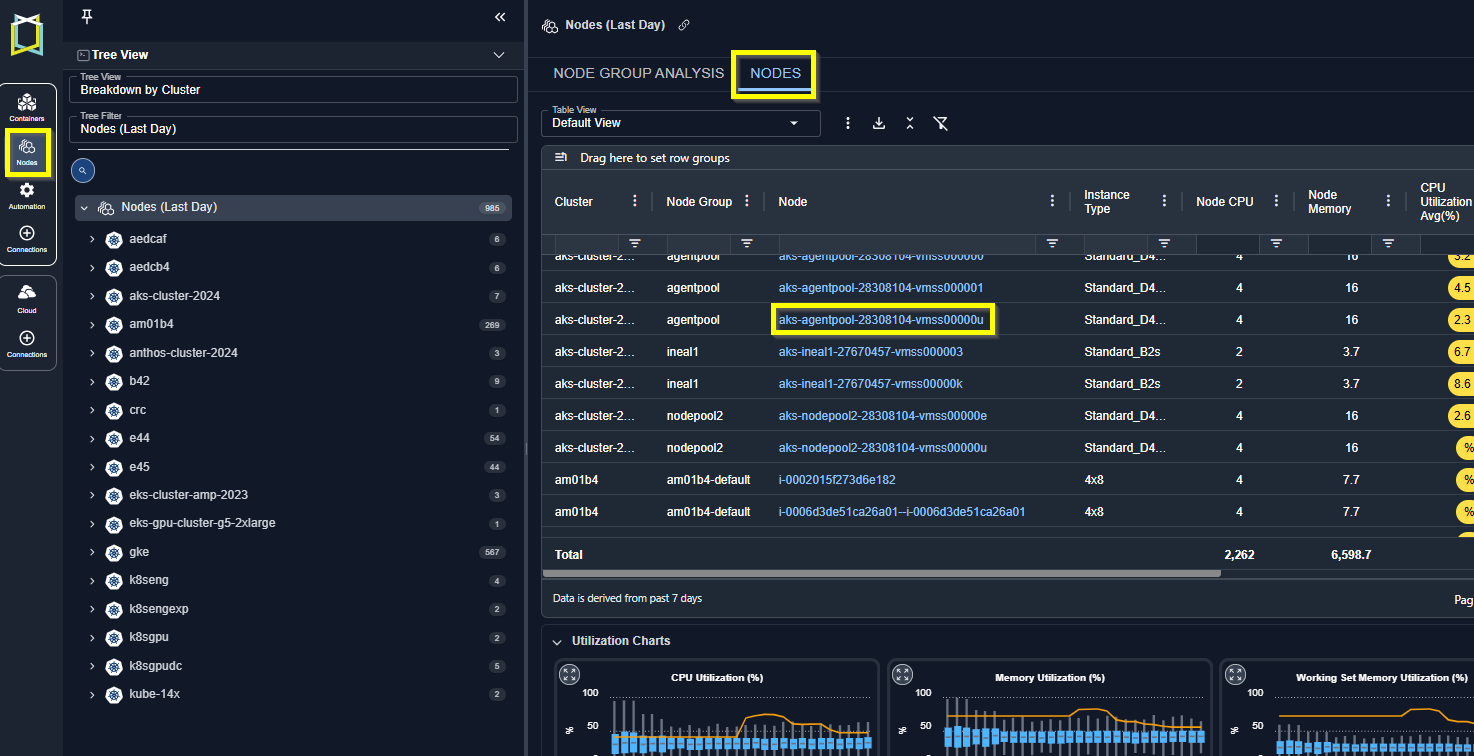
The Nodes report provides utilization details of the individual nodes that are part of node group. You can see key metrics including both peak and average utilization for both CPU and memory. These metrics highlight container performance and stability issues.

<Frame caption="Figure: Nodes Tab">
  <img src="https://mintcdn.com/densify/qkPZFArjNU_c5QkI/images/docs-kubex/Content/Kubex/03000127.png?fit=max&auto=format&n=qkPZFArjNU_c5QkI&q=85&s=1662886ca79dca46f4c22cdb7f8e459b" alt="" width="1474" height="756" data-path="images/docs-kubex/Content/Kubex/03000127.png" />
</Frame>

More significantly, you can now see the pods as a percentage of the maximum allowed on a node and identify where nodes are unable to host more pods, due to the maximum CPU and /or memory value being too low. i.e. a virtual constraint.

You can create filters at the column or table level. See [Using Table Column Features](/docs-kubex/Content/Kubex/Using_Table_Column_Features).

## Pre-Configured Views

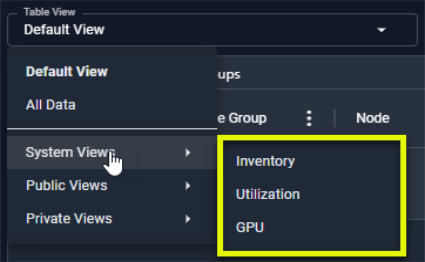
The following pre-configured table views are provided to quickly show various issues in your environment. Specific filters have been set and selected columns are displayed to highlight the specified risk or waste issue.
<Frame caption="Figure: Selecting a Node System View">
  <img src="https://mintcdn.com/densify/zZdJaPjmZYmfrfqT/images/docs-kubex/Content/Kubex/03000101_425x262.png?fit=max&auto=format&n=zZdJaPjmZYmfrfqT&q=85&s=6c83c18c7c176471a37fad41d3577539" alt="" width="425" height="262" data-path="images/docs-kubex/Content/Kubex/03000101_425x262.png" />
</Frame>

The content of the table as well as the totals at the bottom reflect the applied filter settings. Not all columns may be displayed in a selected view, but you can add them at any time. See [Using Table Column Features](/docs-kubex/Content/Kubex/Using_Table_Column_Features).
The folowing system views provide commonly used reports:

<Accordion title="Table: Pre-Configured Views">
  <table style={{ width: "100%", borderCollapse: "collapse" }}>
    <colgroup>
      <col style={{ width: "15%" }} />

      <col style={{ width: "30%" }} />

      <col style={{ width: "55%" }} />
    </colgroup>

    <thead>
      <tr>
        <th style={{ verticalAlign: "middle" }}>System View</th>
        <th style={{ verticalAlign: "middle" }}>View</th>
        <th style={{ verticalAlign: "middle" }}>Description</th>
      </tr>
    </thead>

    <tbody>
      <tr>
        <td style={{ verticalAlign: "middle" }}>Default View</td>
        <td style={{ verticalAlign: "middle" }}>N/A</td>

        <td style={{ verticalAlign: "middle" }}>
          This is the most commonly used set of columns that provide a summary view of your nodes. CPU and memory utilization as a percentage of the total provide a visual indicator of the available capacity.
        </td>
      </tr>

      <tr>
        <td style={{ verticalAlign: "middle" }}>All Data</td>
        <td style={{ verticalAlign: "middle" }}>N/A</td>

        <td style={{ verticalAlign: "middle" }}>
          All columns are displayed. All filters are cleared. Horizontal and vertical scroll bars are displayed so you can navigate the content of the table.
        </td>
      </tr>

      <tr>
        <td style={{ verticalAlign: "middle" }} rowSpan="3">System Views</td>
        <td style={{ verticalAlign: "middle" }}>Inventory</td>

        <td style={{ verticalAlign: "middle" }}>
          This view focuses on the number and type of nodes in your environments.
        </td>
      </tr>

      <tr>
        <td style={{ verticalAlign: "middle" }}>Utilization</td>

        <td style={{ verticalAlign: "middle" }}>
          This view shows how effectively the nodes are being used.
        </td>
      </tr>

      <tr>
        <td style={{ verticalAlign: "middle" }}>GPU</td>

        <td style={{ verticalAlign: "middle" }}>
          This view shows nodes with GPU allocated GPU resources.
        </td>
      </tr>
    </tbody>
  </table>
</Accordion>

## Node Details

This report provides the following details for a single node:

The following table lists the columns in alphabetical order for easy reference. The display order of the columns in the UI are for improved usability.

<Accordion title="Table: Node Details Table - Listed in Alphabetical Order">
  <table style={{ width: "100%" }}>
    <colgroup>
      <col style={{ width: "119px" }} />

      <col style={{ width: "394px" }} />
    </colgroup>

    <thead>
      <tr>
        <th scope="col">
          <p>Column</p>
        </th>

        <th scope="col">
          <p>Description</p>
        </th>
      </tr>
    </thead>

    <tbody>
      <tr>
        <td>
          <p>Age (days)</p>
        </td>

        <td>
          <p>The number of days since the node was first discovered by <span>Kubex</span>.</p>
        </td>
      </tr>

      <tr>
        <td>
          <p>Allocatable CPU (cores)</p>
        </td>

        <td>
          <p>The number of CPUs that can be allocated to pods.</p>
        </td>
      </tr>

      <tr>
        <td>
          <p>Allocatable Memory (GB)</p>
        </td>

        <td>
          <p>The amount of memory that can be allocated to pods.</p>
        </td>
      </tr>

      <tr>
        <td>
          <p>Cluster</p>
        </td>

        <td>
          <p>The cluster name containing the selected node group/nodes.</p>
        </td>
      </tr>

      <tr>
        <td>
          <p>CPU Utilization - Avg (%)</p>
        </td>

        <td>
          <p>The average CPU utilization for this node,   during the past 7 days of history.</p>
          <p>The cell will be shaded when the value exceeds 90%.</p>
        </td>
      </tr>

      <tr>
        <td>
          <p>CPU Utilization - Peak (%)</p>
        </td>

        <td>
          <p>The maximum CPU utilization for this node,   during the past 7 days of history.</p>
          <p>The cell will be shaded when the value exceeds 90%.</p>
        </td>
      </tr>

      <tr>
        <td>
          <p>First Seen Date</p>
        </td>

        <td>
          <p>The date, on which this instance was first discovered by <span>Kubex</span>.</p>
        </td>
      </tr>

      <tr>
        <td>
          <p>Instance Type</p>
        </td>

        <td>
          <p>The node's instance type. </p>
          <p>In cases where the instance type cannot be determined (i.e. bare-metal, private cloud environments) the primary node type is indicated as: CPU x memory size, e.g. 8x16. </p>
          <p>A dash (-) indicates that the node instance details could not be determined.</p>
        </td>
      </tr>

      <tr>
        <td>
          <p>Last Seen Date</p>
        </td>

        <td>
          <p>The date, on which this instance last had CPU utilization data collected by <span>Kubex</span>.</p>
        </td>
      </tr>

      <tr>
        <td>
          <p>Memory Utilization - Avg (%)</p>
        </td>

        <td>
          <p>The average memory utilization for this node,   during the past 7 days of history.</p>
          <p>The cell will be shaded when the value exceeds 90%.</p>
        </td>
      </tr>

      <tr>
        <td>
          <p>Max Allowed Pods</p>
        </td>

        <td>
          <p>The optimal configuration for the maximum number of pods allowed on this node.</p>
        </td>
      </tr>

      <tr>
        <td>
          <p>Memory Utilization - Peak (%)</p>
        </td>

        <td>
          <p>The maximum memory utilization for this node,   during the past 7 days of history.</p>
          <p>The cell will be shaded when the value exceeds 90%.</p>
        </td>
      </tr>

      <tr>
        <td>
          <p><a name="Node" />Node</p>
        </td>

        <td>
          <p>The node name. The name is a hyperlink that opens a modal view of the <a href="/docs-kubex/Content/Kubex/Node-Overview-Tab.htm">Node Overview</a> tab. </p>
        </td>
      </tr>

      <tr>
        <td>
          <p>Node CPU</p>
        </td>

        <td>
          <p>The total number of CPUs on this instance type.</p>
        </td>
      </tr>

      <tr>
        <td>
          <p>Node Group</p>
        </td>

        <td>
          <p>The name of the node group that contains the selected node.</p>
          <p>For nodes that do not belong to a node group, the node group value should be \<<span>cluster-name</span>>-default”</p>
        </td>
      </tr>

      <tr>
        <td>
          <p>Node Memory (GB)</p>
        </td>

        <td>
          <p>The total amount of memory configured on this instance type.</p>
        </td>
      </tr>

      <tr>
        <td>
          <p>Node Group ID</p>
        </td>

        <td>
          <p>The unique identifier of the node group, to which this node currently belongs.</p>
        </td>
      </tr>

      <tr>
        <td>
          <p>Node Hours</p>
        </td>

        <td>
          <p>The total number of hours that this node has been up and running, based on CPU utilization,   during the past 7 days of history.</p>
        </td>
      </tr>

      <tr>
        <td>
          <p>Node ID</p>
        </td>

        <td>
          <p>The unique identifier or the node.</p>
        </td>
      </tr>

      <tr>
        <td>
          <p>No. of Pods - Avg</p>
        </td>

        <td>
          <p>The average number of pods running on this node during the past 7 days of history.</p>
        </td>
      </tr>

      <tr>
        <td>
          <p>No. of Pods - Peak</p>
        </td>

        <td>
          <p>The maximum number of pods running on this node during the past 7 days of history.</p>
        </td>
      </tr>

      <tr>
        <td>
          <p>Pods (% of Max Allowed)</p>
        </td>

        <td>
          <p>The ratio of the maximum number of pods that were run versus the maximum that the node could support, in the last 7 days.</p>
          <p>Calculated as the (peak number of pods)/(maximum allowed pods).</p>
          <p>The cell will be shaded when the value exceeds 90%.</p>
        </td>
      </tr>
    </tbody>
  </table>
</Accordion>

## GPU Details

The report provides the following additional GPU details for a single node:
The following table lists the columns in alphabetical order for easy reference. The display order of the columns in the table are for improved usability.

<Accordion title="Table: Node Details Table - Listed in Alphabetical Order">
  <table style={{ width: "100%", borderCollapse: "collapse" }}>
    <colgroup>
      <col style={{ width: "119px" }} />

      <col style={{ width: "394px" }} />
    </colgroup>

    <thead>
      <tr>
        <th style={{ verticalAlign: "middle" }}>Column</th>
        <th style={{ verticalAlign: "middle" }}>Description</th>
      </tr>
    </thead>

    <tbody>
      <tr>
        <td style={{ verticalAlign: "middle" }}>Allocatable GPU (GPUs)</td>
        <td style={{ verticalAlign: "middle" }}>The availble GPU that can be allocated to containers.</td>
      </tr>

      <tr>
        <td style={{ verticalAlign: "middle" }}>Allocatable GPU Memory (MB)</td>
        <td style={{ verticalAlign: "middle" }}>The availble GPU memory that can be allocated to containers.</td>
      </tr>

      <tr>
        <td style={{ verticalAlign: "middle" }}>GPUs</td>
        <td style={{ verticalAlign: "middle" }}>The available GPU configured on this node.</td>
      </tr>

      <tr>
        <td style={{ verticalAlign: "middle" }}>GPU Memory (GB)</td>
        <td style={{ verticalAlign: "middle" }}>The available GPU memory configured on this node.</td>
      </tr>

      <tr>
        <td style={{ verticalAlign: "middle" }}>GPU Model</td>
        <td style={{ verticalAlign: "middle" }}>The model of the GPU configured on this node.</td>
      </tr>

      <tr>
        <td style={{ verticalAlign: "middle" }}>GPU Memory Utilization - Avg (%)</td>
        <td style={{ verticalAlign: "middle" }}>This is the average GPU memory usage, as a percentage of the allocated GPU memory value.</td>
      </tr>

      <tr>
        <td style={{ verticalAlign: "middle" }}>GPU Memory Utilization Peak (%)</td>
        <td style={{ verticalAlign: "middle" }}>This is the peak GPU memory usage, as a percentage of the allocated GPU memory value.</td>
      </tr>

      <tr>
        <td style={{ verticalAlign: "middle" }}>GPU Power Usage - Average (Watts)</td>
        <td style={{ verticalAlign: "middle" }}>The average power usage for the average number of containers.</td>
      </tr>

      <tr>
        <td style={{ verticalAlign: "middle" }}>GPU Power Usage - Peak (Watts)</td>
        <td style={{ verticalAlign: "middle" }}>The highest peak value in watts, on the busiest container. Currently, this peak value is the 5-min average value and not the maximum within the 5-minute interval.</td>
      </tr>

      <tr>
        <td style={{ verticalAlign: "middle" }}>GPU Utilization - Avg (%)</td>
        <td style={{ verticalAlign: "middle" }}>This is the average GPU usage, as a percentage of the allocated GPU value.</td>
      </tr>

      <tr>
        <td style={{ verticalAlign: "middle" }}>GPU Utilization - Peak (%)</td>
        <td style={{ verticalAlign: "middle" }}>The is the peak GPU usage, as a percentage of the allocated GPU value.</td>
      </tr>

      <tr>
        <td style={{ verticalAlign: "middle" }}>GPU Replicas</td>
        <td style={{ verticalAlign: "middle" }}>The number of replicas using the allocated GPU.</td>
      </tr>

      <tr>
        <td style={{ verticalAlign: "middle" }}>GPU Sharing Strategy</td>
        <td style={{ verticalAlign: "middle" }}>The method used to allow multiple containers to share a single GPU. Possible values are None, MPS and Time-Slicing.</td>
      </tr>

      <tr>
        <td style={{ verticalAlign: "middle" }}>Unallocated GPUs (GPUs)</td>
        <td style={{ verticalAlign: "middle" }}>Available GPU resources that have not been allocated.</td>
      </tr>
    </tbody>
  </table>

  Please observe the following for all node data:

  * Missing data is indicated with a dash (-).
  * A footnote indicates that the data is derived from the past 7 days of history. Nodes appear in the tree viewer immediately after data collection (last day), but values in some columns are based on 7 days of aggregated data.
</Accordion>

## Using the Utilization Chart

Clicking on any row in the tabular report, in the upper pane, shows the utilization details in the <strong>Utilization Charts</strong>.
If the lower pane has been collapsed, click the icon in the upper left corner to expand the pane.

<Frame caption="Figure: Expanding the Lower Pane">
  <img src="https://mintcdn.com/densify/It6BkcRegrIhp2zo/images/docs-kubex/Content/Kubex/03000139.png?fit=max&auto=format&n=It6BkcRegrIhp2zo&q=85&s=88cbc9321c5253c59a5c2153fd3296dc" alt="" width="211" height="81" data-path="images/docs-kubex/Content/Kubex/03000139.png" />
</Frame>

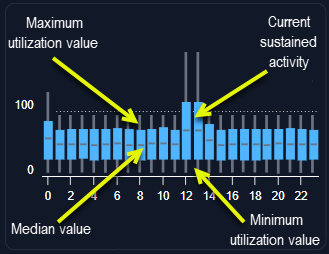
Utilization charts show hourly min/max and sustained activity for the selected node. The charts show the current utilization and the request values for the selected metrics.
The following charts are available:
<div style={{ width: "80%", display:"flex", flexDirection:"row", alignItems:"center", justifyContent: "space-between" }}>
  <ul>
    <li>CPU Utilization (%)</li>
    <li>No. of Pods</li>
  </ul>

  <ul>
    <li>Memory Utilization (%)</li>
    <li>Working Set Memory Utilization (%)</li>
  </ul>
</div>

<Note>
  <strong>Note:</strong> If the required metrics are not available, the corresponding charts are not displayed.
</Note>

<Columns>
  <Frame caption="Figure: Utilization Chart Data">
    <img src="https://mintcdn.com/densify/zZdJaPjmZYmfrfqT/images/docs-kubex/Content/Kubex/03000069.png?fit=max&auto=format&n=zZdJaPjmZYmfrfqT&q=85&s=c078b80f2ab0cf231eeb7021a0a222bb" width="329" height="254" data-path="images/docs-kubex/Content/Kubex/03000069.png" />
  </Frame>

  <Frame caption="Figure: Utilization Chart Request/Limit ">
    <img src="https://mintcdn.com/densify/JV3F9NQeWJDSttAM/images/docs-kubex/Content/Kubex/03000217.png?fit=max&auto=format&n=JV3F9NQeWJDSttAM&q=85&s=2317dc92beb4d695af984ac8b1e275c3" width="319" height="257" data-path="images/docs-kubex/Content/Kubex/03000217.png" />
  </Frame>
</Columns>

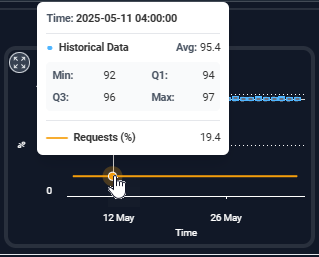
The Y-axis is scaled dynamically to match the range of data. The orange line, indicating the current request setting is shown and the setting of the Y-axis scale also accounts for the request setting.

Hover over any time or date on the current or recommended lines and click to see the detailed data.

An icon in the corner of each chart provides a zoom feature:

<div style={{ width: "100%", display:"flex", flexDirection:"row", alignItems:"center", gap:"20px"}}>
  <Frame>
    <img src="https://mintcdn.com/densify/zZdJaPjmZYmfrfqT/images/docs-kubex/Content/Kubex/03000038_46x44.png?fit=max&auto=format&n=zZdJaPjmZYmfrfqT&q=85&s=4a407609bd306dc93be660a1d3c6c4f9" width={"100%"} style={{ objectFit: "contain" }} data-path="images/docs-kubex/Content/Kubex/03000038_46x44.png" />
  </Frame>

  <div style={{ flex: 1 }}>
    <p>You can zoom in on the chart for easier viewing. All information indicated above is provided so you can review hourly data for the selected container. Arrows on each side of the selected chart allow to scroll through the other available charts.</p>
  </div>
</div>

### Using the Legend

<ol start="1">
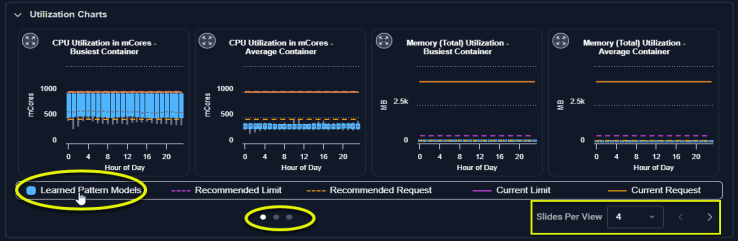
  <li>You can select or de-select the data displayed on each chart using the legend located below the charts.</li>

  <li>
    Click an option to add or remove it from the displayed charts.

    <a name="kanchor16" />
  </li>
</ol>

<Frame caption="Figure: Utilization Charts - Using the Legend">
  <img src="https://mintcdn.com/densify/zZdJaPjmZYmfrfqT/images/docs-kubex/Content/Kubex/03000089_738x241.png?fit=max&auto=format&n=zZdJaPjmZYmfrfqT&q=85&s=c2e79c186994004fc4bac9388c1b3584" alt="" width="738" height="241" data-path="images/docs-kubex/Content/Kubex/03000089_738x241.png" />
</Frame>

Use the left/right arrows to scroll through the available utilization charts.

## Expanded Modal View

<div style={{ width: "100%", display:"flex", flexDirection:"row", alignItems:"center", gap:"20px"}}>
  <Frame>
    <img src="https://mintcdn.com/densify/zZdJaPjmZYmfrfqT/images/docs-kubex/Content/Kubex/03000038_45x43.png?fit=max&auto=format&n=zZdJaPjmZYmfrfqT&q=85&s=bfd7d55cf630d5aa5d5a0a50726e973a" width={"100%"} style={{ objectFit: "contain" }} data-path="images/docs-kubex/Content/Kubex/03000038_45x43.png" />
  </Frame>

  <div style={{ flex: 1 }}>
    <p>Clicking the zoom button opens the chart in a modal view with additional options to view the collected and analyzed data.</p>
  </div>
</div>

The following options allow you to view all details your data:

<Accordion title="Table: Modal View Data Aggregation Options">
  <table style={{ width: "100%", borderCollapse: "collapse" }}>
    <colgroup>
      <col style={{ width: "15%" }} />

      <col style={{ width: "85%" }} />
    </colgroup>

    <thead>
      <tr>
        <th style={{ verticalAlign: "middle" }}>Option</th>
        <th style={{ verticalAlign: "middle" }}>Description</th>
      </tr>
    </thead>

    <tbody>
      <tr>
        <td style={{ verticalAlign: "middle" }}>ML Model</td>
        <td style={{ verticalAlign: "middle" }}>Not available for nodes.</td>
      </tr>

      <tr>
        <td style={{ verticalAlign: "middle" }}>Historical Daily</td>

        <td style={{ verticalAlign: "middle" }}>
          The nodes's data, is aggregated for a single day. You can see the minimum, maximum, sustained and average values by clicking on any data point. The timezone of the data is UTC.

          <br />

          Use the slider at the bottom to select the historical days of data to review. Up to 90 days of data is retained.
        </td>
      </tr>

      <tr>
        <td style={{ verticalAlign: "middle" }}>Historical Hourly</td>

        <td style={{ verticalAlign: "middle" }}>
          The node's data, aggregated for a single hour. Like the historical daily view, you can see the minimum, maximum, sustained and average values by clicking on any data point. The timezone of the data is UTC.

          <br />

          Use the slider at the bottom to select the range of data to view.
        </td>
      </tr>

      <tr>
        <td style={{ verticalAlign: "middle" }}>Historical (5 Min)</td>
        <td style={{ verticalAlign: "middle" }}>Not available for nodes.</td>
      </tr>
    </tbody>
  </table>
</Accordion>