> ## Documentation Index
> Fetch the complete documentation index at: https://docs.kubex.ai/llms.txt
> Use this file to discover all available pages before exploring further.

# Single Container Summary

export const InlineImageWithText = ({src, href, children, width = 80, caption}) => {
  return <span className="inline-flex items-center gap-3 align-middle">
            <a href={href} className="inline-block border-b-0">
                <Frame caption={caption}>
                    <img src={src} alt="" className="object-contain align-middle " width={width} style={{
    minWidth: width
  }} />
                </Frame>
            </a>
            <span className="align-middle">{children}</span>
        </span>;
};

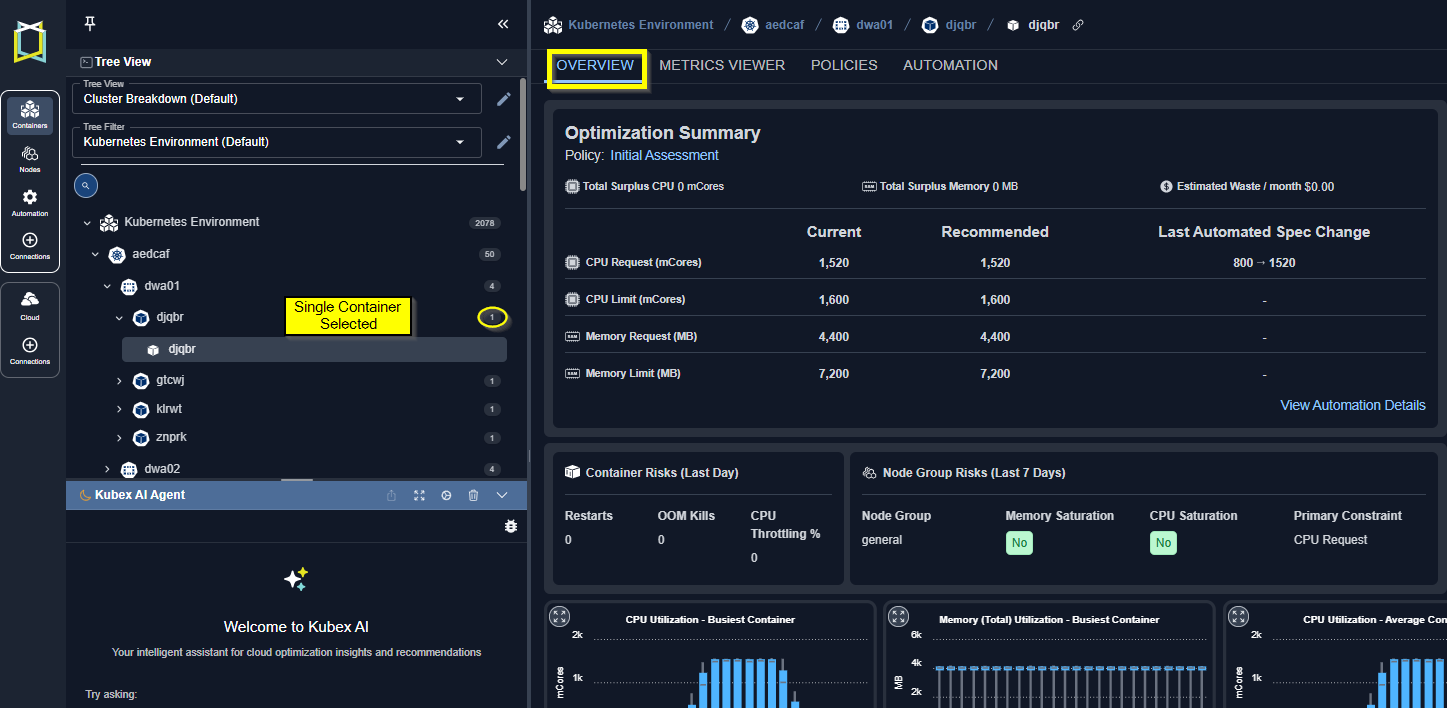
The cards on this tab provide a visual overview of a single container.

When navigating the [tree viewer](/docs-kubex/Content/Kubex/Using_the_Tree_Viewer), you will see this tab when a single item is selected.
You will see the [Summary tab](#) when more than one container is selected.

<Frame caption="Figure: Locating the Overview Tab">
  <img src="https://mintcdn.com/densify/qkPZFArjNU_c5QkI/images/docs-kubex/Content/Kubex/03000122_694x253.png?fit=max&auto=format&n=qkPZFArjNU_c5QkI&q=85&s=e0e75364f7123058a0389bdac470255f" alt="" width="1447" height="708" data-path="images/docs-kubex/Content/Kubex/03000122_694x253.png" />
</Frame>

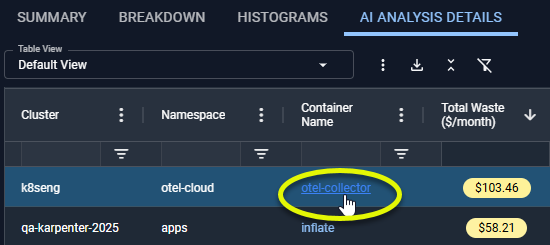
You will also see a modal view of this page when you click the hyperlink in the [Analysis Details](/docs-kubex/Content/Kubex/AI_Analysis_Details_Table#hyperlink) tab. This tab provides the container details in a format that is easier to view and to compare the current versus the recommended settings.
<Frame caption="Figure: Accessing the Container Manifest Details">
  <img src="https://mintcdn.com/densify/JV3F9NQeWJDSttAM/images/docs-kubex/Content/Kubex/03000220.png?fit=max&auto=format&n=JV3F9NQeWJDSttAM&q=85&s=b30cc498a0ae966d3ea2927b841c398f" alt="" width="550" height="245" data-path="images/docs-kubex/Content/Kubex/03000220.png" />
</Frame>

You also have access to the [metrics viewer](/docs-kubex/Content/Kubex/Metrics_Viewer_Tab) when a single container is selected.

## Optimization Summary

This card highlights your current & recommended settings based on utilization.
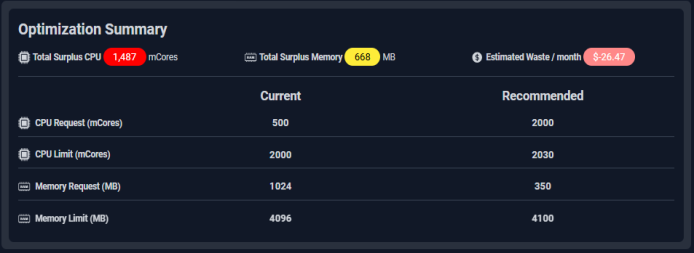
<Frame caption="Figure: Optimization Summary">
  <img src="https://mintcdn.com/densify/JV3F9NQeWJDSttAM/images/docs-kubex/Content/Kubex/03000221_694x253.png?fit=max&auto=format&n=JV3F9NQeWJDSttAM&q=85&s=2fff4fa65d3201dbc61c346b3c5814e9" alt="" width="694" height="253" data-path="images/docs-kubex/Content/Kubex/03000221_694x253.png" />
</Frame>

<table>
  <tbody>
    <tr>
      <td>
        <ul>
          <li>
            <Tooltip tip="The total surplus CPU request value for the container.">Total Surplus CPU Request (mCores)</Tooltip>
          </li>

          <li>
            <Tooltip tip="The total surplus memory request value for the container.">Total Surplus Memory Request (MB)</Tooltip>
          </li>

          <li>
            <Tooltip tip="The total surplus memory request value for the container.">Estimated Waste</Tooltip>
          </li>
        </ul>
      </td>

      <td>
        <ul>
          <li>
            <Tooltip tip="The current and recommended CPU request value for the container. It is calculated as (current | recommended request * No. of Containers).">CPU Request (mCores)</Tooltip>
          </li>

          <li>
            <Tooltip tip="The current and recommended CPU limit value for the container. It is calculated as (current | recommended limit * No. of Containers).">CPU Limit (mCores)</Tooltip>
          </li>

          <li>
            <Tooltip tip="The current and recommended memory request value for the container. It is calculated as (current or recommended request * No. of Containers).">Total Memory Request (MB)</Tooltip>
          </li>

          <li>
            <Tooltip tip="The current and recommended memory limit value for the container. It is calculated as (current or recommended limit * No. of Containers).">Total Memory Limit (MB)</Tooltip>
          </li>
        </ul>
      </td>
    </tr>
  </tbody>
</table>

### Containers with Unspecified Settings

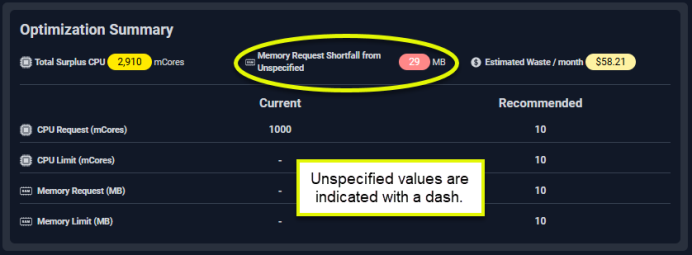
If the selected manifest does not have CPU or memory request values set, additional cards with details of the impact of unspecified values are shown. See [Containers with Unspecified Settings](/docs-kubex/Content/Kubex/AI_Analysis_Details_Table#unspecified) for more details.

<Frame caption="Figure: Optimization Summary - Unspecified Request Settings">
  <img src="https://mintcdn.com/densify/JV3F9NQeWJDSttAM/images/docs-kubex/Content/Kubex/03000196_692x255.png?fit=max&auto=format&n=JV3F9NQeWJDSttAM&q=85&s=6d3005a1083173b3b086218e6b6ca2ed" alt="" width="692" height="255" data-path="images/docs-kubex/Content/Kubex/03000196_692x255.png" />
</Frame>

<table>
  <tbody>
    <tr>
      <td>
        <ul>
          <li>
            <Tooltip tip="This is the total CPU request value for the container and is calculated as (current value * No. of Containers).">Total Surplus CPU Request (mCores)</Tooltip>
          </li>

          <li>
            <Tooltip tip="This is the total surplus memory request value for the container and is calculated as (current value * No. of Containers). If unspecified it is listed as shortfall.">Total Surplus Memory Request (MB)</Tooltip>
          </li>

          <li>
            <Tooltip tip="If the recommendations are implemented, the total savings per container are indicated here. When calculating costs the Recommended CPU or Recommended CPU and Memory request values are used for containers that have no request values specified.">Estimated Waste/month</Tooltip>
          </li>
        </ul>
      </td>
    </tr>
  </tbody>
</table>

## Container Information

Click any of the listed settings to see a brief description. Complete descriptions of each setting are provided in the [Analysis Details Table](/docs-kubex/Content/Kubex/AI_Analysis_Details_Table).
Identifying details are displayed on this card.

<InlineImageWithText width="500" src="/images/docs-kubex/Content/Kubex/03000079.png">
  <ul>
    <li>Container Name</li>
    <li>Cluster</li>
    <li>Namespace</li>

    <li>
      <Tooltip tip="The name of the controller or pod. You can have one or more containers per pod.">Pod Owner Name</Tooltip>
    </li>

    <li>
      <Tooltip tip="The controller type that monitors and maintains the state of your cluster. This can be one of DaemonSet, Deployment, ReplicaSet, ReplicationController, StatefulSet, etc.">Pod Owner Kind</Tooltip>
    </li>

    <li>
      <Tooltip tip="Uptime % is the total time the container has been running as a percentage of the total hours since the container was deployed. (Running Hrs/Total Hrs)">Predicted Uptime</Tooltip>
    </li>

    <li>
      <Tooltip tip="The current number of containers running in the selected cluster/namespace/pod combination.">Avg No. of Containers</Tooltip>
    </li>
  </ul>
</InlineImageWithText>

The cost per core and per GB of memory is configurable. Contact [support@kubex.ai](mailto:support@kubex.ai) for details.

## Risk Summary

These 2 cards summarize potential resource risks for the container and node group, on which the containers are running.

<Frame caption="Figure: Risk Summary Details">
  <img src="https://mintcdn.com/densify/r8Gquwq3zru3Cavn/images/docs-kubex/Content/Kubex/03000080_603x130.png?fit=max&auto=format&n=r8Gquwq3zru3Cavn&q=85&s=65ea5594eccb179202a38802c38579ad" alt="" width="1198" height="140" data-path="images/docs-kubex/Content/Kubex/03000080_603x130.png" />
</Frame>

<table>
  <tbody>
    <tr>
      <td>
        <ul>
          <li>
            <Tooltip tip="The total number of restarts of all containers associated with the deployment, in the last day. A dash (-) is displayed if no data has been collected.">Restarts</Tooltip>
          </li>

          <li>
            <Tooltip tip="Indicates how many times this container has a sigkill in the last day">OOM Kills</Tooltip>
          </li>

          <li>
            <Tooltip tip="Maximum CPU throttling seen in any 5-minute interval over the last day. High values indicate periods where CPU limits may have impacted performance.">CPU Throttling %</Tooltip>
          </li>
        </ul>
      </td>

      <td>
        <ul>
          <li>
            <Tooltip tip="The name of any node groups contained in this cluster. If the cluster contains multiple node groups, all node groups are listed. For nodes that do not belong to a node group, the node group value will be <cluster-name> -default”. </cluster-name>">Node Group</Tooltip>
          </li>

          <li>
            <Tooltip tip="Indicates whether or not memory utilization is above the saturation threshold, during the past 7 days of history.">Memory Saturation</Tooltip>
          </li>

          <li>
            <Tooltip tip="Indicates whether or not CPU utilization is above the saturation threshold, during the past 7 days of history.">CPU Saturation</Tooltip>
          </li>

          <li>
            <Tooltip tip="Primary ConstraintIndicates the reason that more containers cannot be added to this node group. The following values are evaluated and whichever has the largest value is identified as the primary constraint: CPU Request, CPU Utilization, Memory Request and Memory Utilization.">Primary Constraint</Tooltip>
          </li>
        </ul>
      </td>
    </tr>
  </tbody>
</table>

## GPU Summary

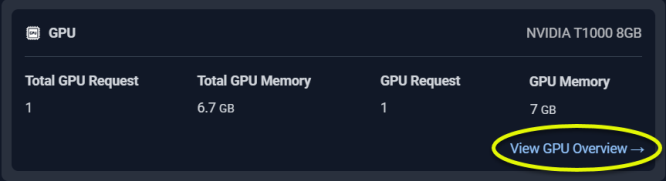
This card summarizes the GPU allocation and for the selected container. This card is only displayed if the GPU resources have been allocated to this container. A hyperlink at the bottom of the card takes you to the GPU page.

<Frame caption="Figure: GPU Summary">
  <img src="https://mintcdn.com/densify/JV3F9NQeWJDSttAM/images/docs-kubex/Content/Kubex/03000222_666x181.png?fit=max&auto=format&n=JV3F9NQeWJDSttAM&q=85&s=c912cdad4bb8b2f6c41635087f1663a6" alt="" width="666" height="181" data-path="images/docs-kubex/Content/Kubex/03000222_666x181.png" />
</Frame>

<table>
  <tbody>
    <tr>
      <td>
        <ul>
          <li>
            <Tooltip tip="The GPU model configured on the parent node.">GPU Model</Tooltip>
          </li>

          <li>
            <Tooltip tip="The total GPU request value, determined as the average number of containers multiplied by the GPU request value.">Total GPU Request</Tooltip>
          </li>

          <li>
            <Tooltip tip="The GPU request per container, as specified in the manifest.">GPU Request</Tooltip>
          </li>
        </ul>
      </td>

      <td>
        <ul>
          <li>
            <Tooltip tip="The total GPU memory request value, determined as the average number of containers multiplied by the GPU memory request value.">Total GPU Memory Request</Tooltip>
          </li>

          <li>
            <Tooltip tip="The GPU memory request per container, as specified in the manifest.">GPU Memory Request</Tooltip>
          </li>
        </ul>
      </td>
    </tr>
  </tbody>
</table>

## Utilization Charts

Utilization charts show hourly min/max and sustained activity for the selected system. The charts show the current and the recommended request and limit values for selected metrics. A chart is only displayed if the required data is available.
Details of working with there charts is provided in [Analysis Details Utilization Charts](/docs-kubex/Content/Kubex/AI_Analysis_Details_Charts).

<InlineImageWithText src="/images/docs-kubex/Content/Kubex/03000208.png">
  <ul>
    <li>
      <Tooltip tip="Shows the number of containers that were running during each hour.">No. of Containers</Tooltip>
    </li>

    <li>
      <Tooltip tip="This charts shows the number of container restarts that occurred during each hour. A message indicates if there were no restarts.">No. of Restarts</Tooltip>
    </li>

    <li>
      <Tooltip tip="All other charts are available on the 'Metrics Viewer' tab.">Other Charts</Tooltip>
    </li>
  </ul>
</InlineImageWithText>

#### Video Resources

<AccordionGroup>
  <Accordion title="Using the Tree Viewer">
    <iframe frameborder="0" height="310" src="https://player.vimeo.com/video/1038945637?title=0&byline=0&portrait=0&badge=0&autopause=0&player_id=0&app_id=58479" width="550" />

    <a href="https://player.vimeo.com/video/1038945637?title=0&byline=0&portrait=0&badge=0&autopause=0&player_id=0&app_id=58479" target="_blank">Using the Tree Viewer</a>
  </Accordion>

  <Accordion title="Using the Utilization Charts">
    <iframe frameborder="0" height="310" src="https://player.vimeo.com/video/1042992591?badge=0&autopause=0&player_id=0&app_id=58479" width="550" />

    <a href="https://player.vimeo.com/video/1042992591?badge=0&autopause=0&player_id=0&app_id=58479" target="_blank">Using the Utilization Charts</a>
  </Accordion>
</AccordionGroup>