 When a single container is selected you will see the [Overview](/docs-kubex/Content/Kubex/Overview_Tab) and [Metrics Viewer](/docs-kubex/Content/Kubex/Metrics_Viewer_Tab) tabs.
## Current Monthly Spend
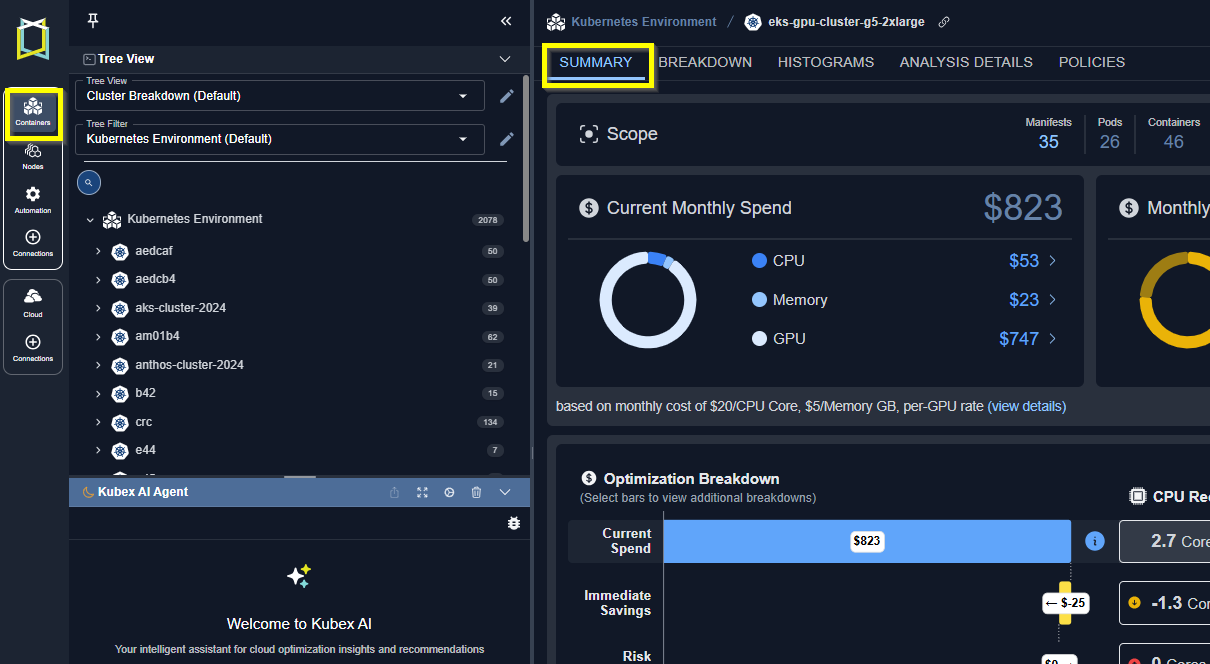
This first chart summarizes your current spend and breaks down CPU, Memory & GPU spend. A hyperlinked value of "manifests"takes you to the [Analysis Details](/docs-kubex/Content/Kubex/AI_Analysis_Details_Table) tab with same scope of systems selected.
When a single container is selected you will see the [Overview](/docs-kubex/Content/Kubex/Overview_Tab) and [Metrics Viewer](/docs-kubex/Content/Kubex/Metrics_Viewer_Tab) tabs.
## Current Monthly Spend
This first chart summarizes your current spend and breaks down CPU, Memory & GPU spend. A hyperlinked value of "manifests"takes you to the [Analysis Details](/docs-kubex/Content/Kubex/AI_Analysis_Details_Table) tab with same scope of systems selected.
 ### Unit Costs
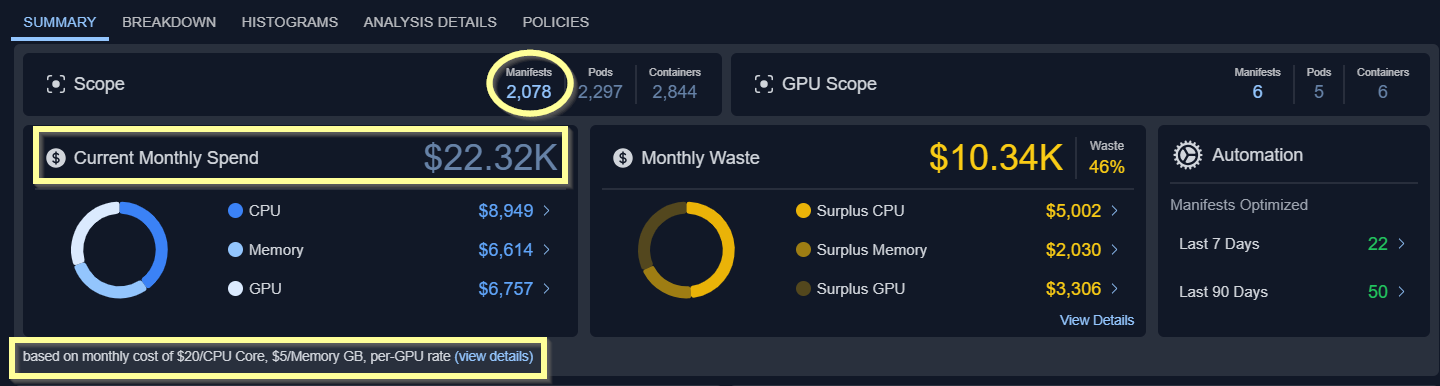
The default unit monthly cost of a vCPU, a GB of Memory, and GPUs are shown here. These values are used for all cost calculations. The values are configurable.
## Monthly Waste
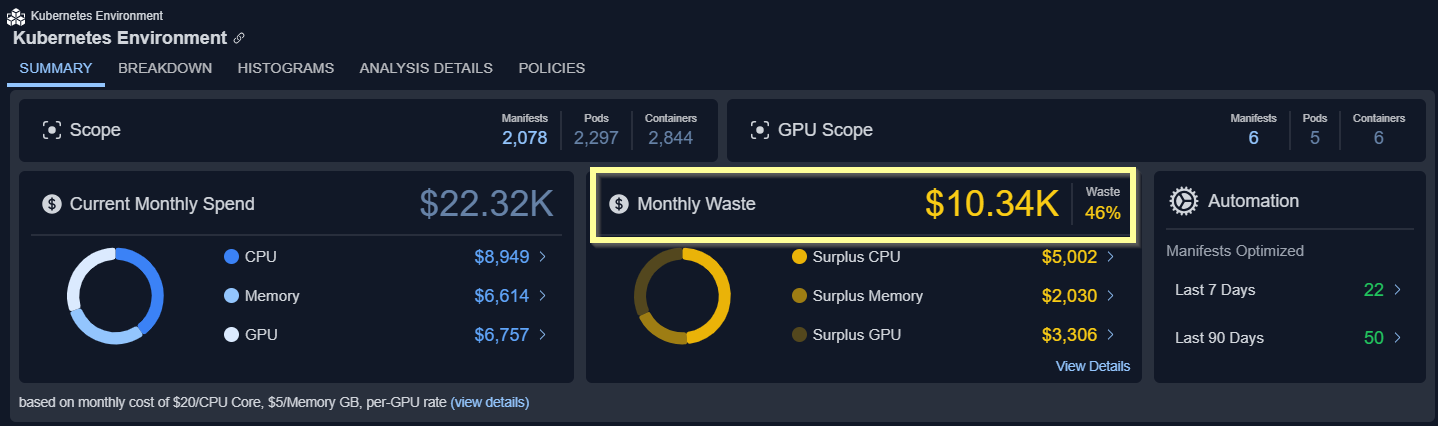
This block shows you wasted resources as a dollar amount broken down by CPU and memory requests. These histogram charts show your data grouped as a distribution. The scope of data, is defined by the tree viewer. The link on the right side of each chart takes you to the [histogram](/docs-kubex/Content/Kubex/Histograms_Tab) page, with same scope of systems selected.
### Unit Costs
The default unit monthly cost of a vCPU, a GB of Memory, and GPUs are shown here. These values are used for all cost calculations. The values are configurable.
## Monthly Waste
This block shows you wasted resources as a dollar amount broken down by CPU and memory requests. These histogram charts show your data grouped as a distribution. The scope of data, is defined by the tree viewer. The link on the right side of each chart takes you to the [histogram](/docs-kubex/Content/Kubex/Histograms_Tab) page, with same scope of systems selected.
 ## GPU Summary
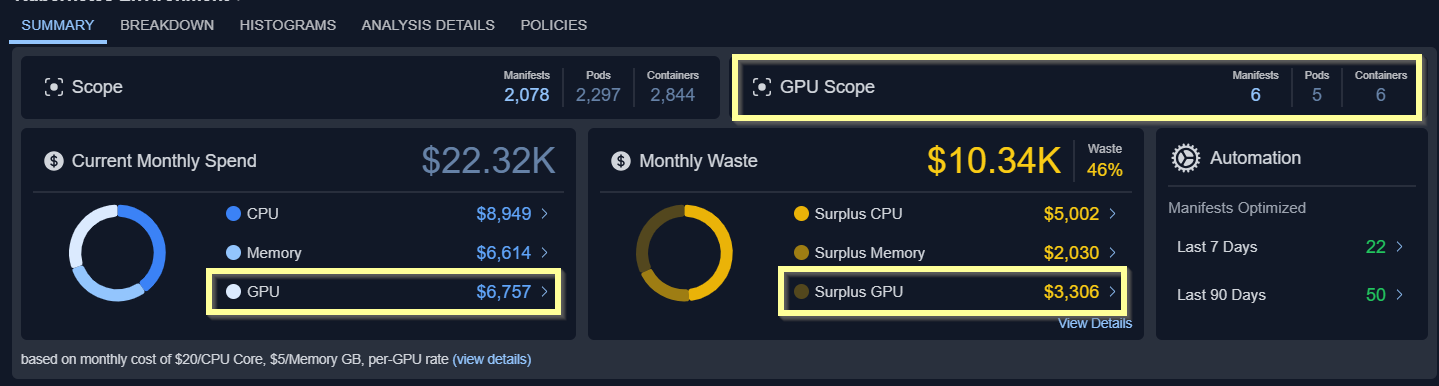
Your GPU spend and allocation are summarized on this card.
## GPU Summary
Your GPU spend and allocation are summarized on this card.
 Click the "view details" hyperlink in the note shown at the bottom of the image to view GPU pricing details. This table provides visibility into how the cost is calculated. The cost per GPU might change greatly depending on the model, so this table provides the model details.
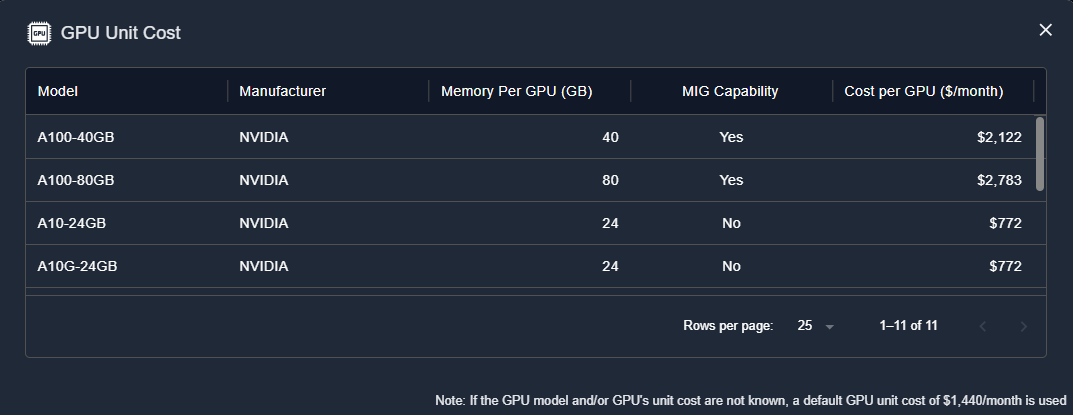 If the GPU model and/or GPU unit cost are unknown, a default GPU unit cost of \$1.4K/month is used for the calculations. This value is configurable. Contact [support@kubex.ai](mailto:support@kubex.ai) for details.
## Optimization Breakdown
This bar chart shows the breakdown of your container spending:
If the GPU model and/or GPU unit cost are unknown, a default GPU unit cost of \$1.4K/month is used for the calculations. This value is configurable. Contact [support@kubex.ai](mailto:support@kubex.ai) for details.
## Optimization Breakdown
This bar chart shows the breakdown of your container spending:
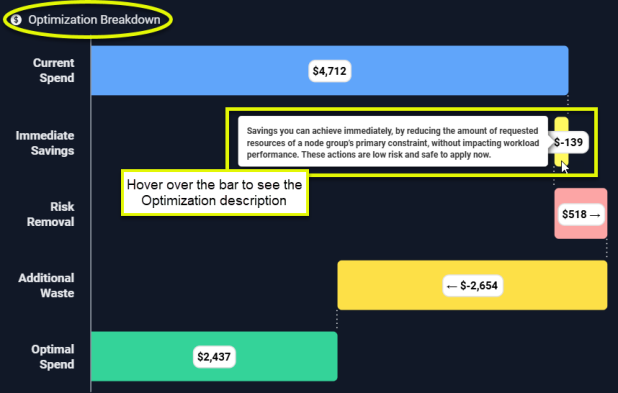 Hover over any of the bars to see a description of the recommended optimization.
| Column | Description |
|---|---|
| Current Spend |
The bar shows you what you are currently spending on the infrastructure that has been selected in the tree viewer. This value includes containers with unspecified CPU and/or memory request. See Containers with Unspecified Settings for details. |
| Immediate Savings |
Immediate savings can be achieved by adjusting the requested settings for containers within Node Groups where CPU or memory requests are the primary constraint. Adjusting these settings does not impact workload performance.
A container qualifies for immediate savings if the "% of Nodes with CPU Saturation" is below a predefined threshold. For example, if the threshold is set at 50%, only containers where "% of Nodes with CPU Saturation" is less than 50% should be considered. Immediate savings can be achieved by adjusting the Memory Request settings only for containers within Node Groups where Memory Request" is the primary constraint. Calculated as: Sum of immediate CPU savings + Sum of immediate memory savings |
| Risk Removal |
The incurred cost to reduce or eliminate resourcing shortfalls that may be causing application restarts, CPU throttling or memory events, including OOM kills.
CPU and memory shortfalls are aggregated for all containers in the selected scope and used to determine this value. Calculated as: Sum(Shortfall CPU\<0 (in mcores))/1000 mcores/core \*CPU unit cost/core + Sum(Shortfall memory \<0 (in MB))/1024 MB/GB \*Memory unit cost/GB |
| Additional Waste |
These are possible, additional savings that can be achieved, after implementing the Risk Removal recommendations. Calculated as (\$Total Cost + Risk Removal - Immediate Savings - Optimal Cost). |
| Optimal Spend |
This is the projected monthly spend if all of the recommendations are made. Calculated as ($Total Cost - $Total Estimated Waste). |