> ## Documentation Index
> Fetch the complete documentation index at: https://docs.kubex.ai/llms.txt
> Use this file to discover all available pages before exploring further.
# Overview
Densify allows you to optimize the performance of your cloud-hosted applications, as well as potentially reduce your cloud costs.
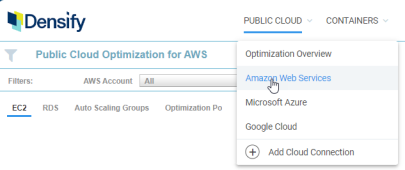
The **Public Cloud** menu is used to identify risk and cost saving opportunities for each type of public cloud environment. The **Optimization Overview** page aggregates all of your services to provide a high-level overview.
The options in the dropdown menu take you to the specific cloud platform dashboard, such as [Amazon Web Services](#AWS), [Microsoft Azure](#Azure), or [Google Cloud](#GCP). Public cloud data for each cloud platform is available after the data is collected, analyzed and the reports populated.
 Refer to [Data Collection for Public Cloud Systems](../Data_Collection_for_Public_Cloud_Systems/Data_Collection_for_Public_Cloud_Systems) for details on data collection for the public cloud.
You can export the cloud service optimization opportunity tabular report, by clicking the Export to Excel icon to export the tabular data for external analysis. See [Exporting Report Data](./Exporting_Report_Data) for details.
You can display specific groups of cloud services using the Guest Filter or the Recommendation Filter Menu. See [Grouping and Filtering Options](./Viewing_Cloud_Optimization_Reports#Filter) for details.
The items, in the public cloud platform-specific optimization opportunities dashboards are described in the sections below.
To learn more watch the following videos:
Public Cloud Optimization Reports
Refer to [Data Collection for Public Cloud Systems](../Data_Collection_for_Public_Cloud_Systems/Data_Collection_for_Public_Cloud_Systems) for details on data collection for the public cloud.
You can export the cloud service optimization opportunity tabular report, by clicking the Export to Excel icon to export the tabular data for external analysis. See [Exporting Report Data](./Exporting_Report_Data) for details.
You can display specific groups of cloud services using the Guest Filter or the Recommendation Filter Menu. See [Grouping and Filtering Options](./Viewing_Cloud_Optimization_Reports#Filter) for details.
The items, in the public cloud platform-specific optimization opportunities dashboards are described in the sections below.
To learn more watch the following videos:
Public Cloud Optimization Reports
Part 1
Public Cloud Optimization Reports
Part 2
Investigating Optimization
Recommendations
Data Tab Data
Management Features
## Amazon Web Services
The AWS dashboard contains tabs with a specific report for each supported AWS service: [EC2](#AWSEC2), [RDS](#AWSRDS) and [Auto Scaling Groups](#AWSASG). Additionally, the [Optimization Policy](../Reporting_Framework/Viewing_Policy_Settings) tab allows you to review the applied policy settings.
### EC2
The EC2 tab reports on your Amazon Elastic Compute Cloud (EC2) instances based on the collected CloudWatch data. This report includes a set of 4 charts and a tabular version of the content highlighting current and recommended sizing and cost details for each EC2 instance type.
See [Viewing Cloud Optimization Reports](./Viewing_Cloud_Optimization_Reports) for details of each component in the EC2 optimization report.
You can investigate each EC2 instance type recommendation by clicking on the number in the **Count** column, This takes you to the Instance Optimization Details page of each EC2 optimization group. Refer to [Understanding the Instance Optimization Details Report](./Understanding_the_Instance_Details_Report) for more details on this page.
Auto Scaling groups configured with maximum group size = 1 are only included in the EC2 optimization opportunity report; Auto Scaling groups configured with maximum group size > 1 are included in the Auto Scaling Groups optimization opportunity report.
### RDS
The optimization opportunity report in the RDS tab displays Amazon Relational Database Service (RDS) instances that are based on the cloud data collected. This report displays the current and recommended sizing and cost details for each RDS instance type, associated with downsizing, upsizing, modernizing, or terminating the RDS instances. See [Viewing Cloud Optimization Reports](./Viewing_Cloud_Optimization_Reports) for details of each component in the RDS optimization opportunity report.
Recommendations are based on the memory metrics and standard infrastructure metrics collected from CloudWatch in the same manner as EC2 instances.
To view details of each RDS instance recommendation group from the report, click on the number in the Count column to view the RDS Instance Optimization Details page. Refer to [Understanding the Instance Optimization Details Report](./Understanding_the_Instance_Details_Report) for more details on this page.
### Auto Scaling Groups
See [Working with Auto Scaling Groups](./Working_with_ASGs) for a description of the optimization opportunities in the Auto Scaling Groups tab.
### Optimization Policies
This tab displays the policies applied to your AWS cloud services to produce recommendations. See [Cloud Optimization Policies](../Reporting_Framework/Viewing_Policy_Settings#CloudOptimizationPolicies) for details.
## Microsoft Azure
### Virtual Machine
This tab displays the optimization opportunity report for Azure Virtual Machine instances. It shows you the current and recommended sizing and cost details for each Virtual Machine instance type, associated with downsizing, upsizing, modernizing, and terminating the instances. See [Viewing Cloud Optimization Reports](./Viewing_Cloud_Optimization_Reports) for details on each component of this report.
You can view each Virtual Machine instance type recommendation by clicking the number in the **Count** column. This hyperlink takes you to the Instance Optimization Details page of each optimization group. Refer to [Understanding the Instance Optimization Details Report](./Understanding_the_Instance_Details_Report) for more details on this page.
VM Scale Sets configured with maximum group size = 1 are only included in the Virtual Machine optimization opportunity report. VM Scale Sets configured with maximum group size > 1 are included in the VM Scale Sets optimization opportunity report.
### VM Scale Sets
See [Working with Virtual Machine Scale Sets](./Working_with_VMSS) for a description of the optimization opportunities in the VM Scale Sets tab.
VM Scale Sets with maximum size=1 are treated like VMs and are counted in the Virtual Machine count, above.
### Optimization Policies
This tab displays the policies applied to your Azure cloud services to produce recommendations. See [Cloud Optimization Policies](../Reporting_Framework/Viewing_Policy_Settings#CloudOptimizationPolicies) for details.
## Google Cloud
### Compute Engine
This tab displays the optimization opportunity report for GCP Compute Engine instances. It displays current and recommended sizing and cost details for each GCP Compute Engine instance type. See [Viewing Cloud Optimization Reports](./Viewing_Cloud_Optimization_Reports) for details on each component of this report.
You can drill down on each Compute Engine instance type recommendation by clicking on the hyperlinked value in the **Count** column. This takes you to the Instance Optimization Details page. Refer to [Understanding the Instance Optimization Details Report](./Understanding_the_Instance_Details_Report) for more details on this page.
### Optimization Policies
This tab displays the policies applied to your GCP services to produce recommendations. See [Cloud Optimization Policies](../Reporting_Framework/Viewing_Policy_Settings#CloudOptimizationPolicies) for details.