> ## Documentation Index
> Fetch the complete documentation index at: https://docs.kubex.ai/llms.txt
> Use this file to discover all available pages before exploring further.

# Viewing Cloud Optimization Reports

The results of Kubex analyses are summarized in the various cloud-specific optimization overview reports. Through these optimization reports Kubex gives you the visibility to manage your workloads in multi-cloud environments.

Components described in this topic are available in the following cloud service optimization reports:

<table>
  <col />

  <col />

  <col />

  <tbody>
    <tr>
      <td>
        <ul>
          <li>AWS EC2</li>
        </ul>
      </td>

      <td>
        <ul>
          <li>Azure Virtual Machines</li>
        </ul>
      </td>

      <td>
        <ul>
          <li>GCP Compute Engines</li>
        </ul>
      </td>
    </tr>
  </tbody>
</table>

To learn more watch the following videos:

<iframe allowfullscreen="allowfullscreen" class="vidyard_iframe" frameborder="0" height="360" mozallowfullscreen="mozallowfullscreen" msallowfullscreen="msallowfullscreen" oallowfullscreen="oallowfullscreen" src="https://player.vimeo.com/video/308576681" webkitallowfullscreen="webkitallowfullscreen" width="640" />

Public Cloud Optimization Reports<br />Part 1

<iframe allowfullscreen="allowfullscreen" class="vidyard_iframe" frameborder="0" height="360" mozallowfullscreen="mozallowfullscreen" msallowfullscreen="msallowfullscreen" oallowfullscreen="oallowfullscreen" src="https://player.vimeo.com/video/411532962" webkitallowfullscreen="webkitallowfullscreen" width="640" />

Public Cloud Optimization Reports<br />Part 2

<iframe allowfullscreen="allowfullscreen" class="vidyard_iframe" frameborder="0" height="360" mozallowfullscreen="mozallowfullscreen" msallowfullscreen="msallowfullscreen" oallowfullscreen="oallowfullscreen" src="https://player.vimeo.com/video/494121314" webkitallowfullscreen="webkitallowfullscreen" width="640" />

Investigating Optimization<br />Recommendations

<iframe allowfullscreen="allowfullscreen" class="vidyard_iframe" frameborder="0" height="360" mozallowfullscreen="mozallowfullscreen" msallowfullscreen="msallowfullscreen" oallowfullscreen="oallowfullscreen" src="https://player.vimeo.com/video/542858527" webkitallowfullscreen="webkitallowfullscreen" width="640" />

Data Tab Data<br />Management Features

Details for the other tabs are provided in the following topics:

* AWS RDS and Spot Instances--See [Viewing Cloud Optimization Reports - RDS](./Viewing_Cloud_Optimization_Reports_-_RDS).
* AWS Auto Scaling Groups--See
  [Working with Auto Scaling Groups](./Working_with_ASGs).
* Azure Vitual Machine Scale Sets--See
  [Working with Virtual Machine Scale Sets](./Working_with_VMSS).

<Accordion title="Figure: AWS Optimization Report ">
  <Frame>
    <img src="https://mintcdn.com/densify/Ye93Za_2mutk-EEJ/images/docs/WebHelp_Densify_Cloud/Content/Resources/Images/Cirba_SaaS/06000040.png?fit=max&auto=format&n=Ye93Za_2mutk-EEJ&q=85&s=bdaf7ab991920e27cfaa2970a180ca5e" alt="" width="1781" height="749" data-path="images/docs/WebHelp_Densify_Cloud/Content/Resources/Images/Cirba_SaaS/06000040.png" />
  </Frame>
</Accordion>

<Note>
  Instances without adequate data to perform the required analyses are not included in these reports.
</Note>

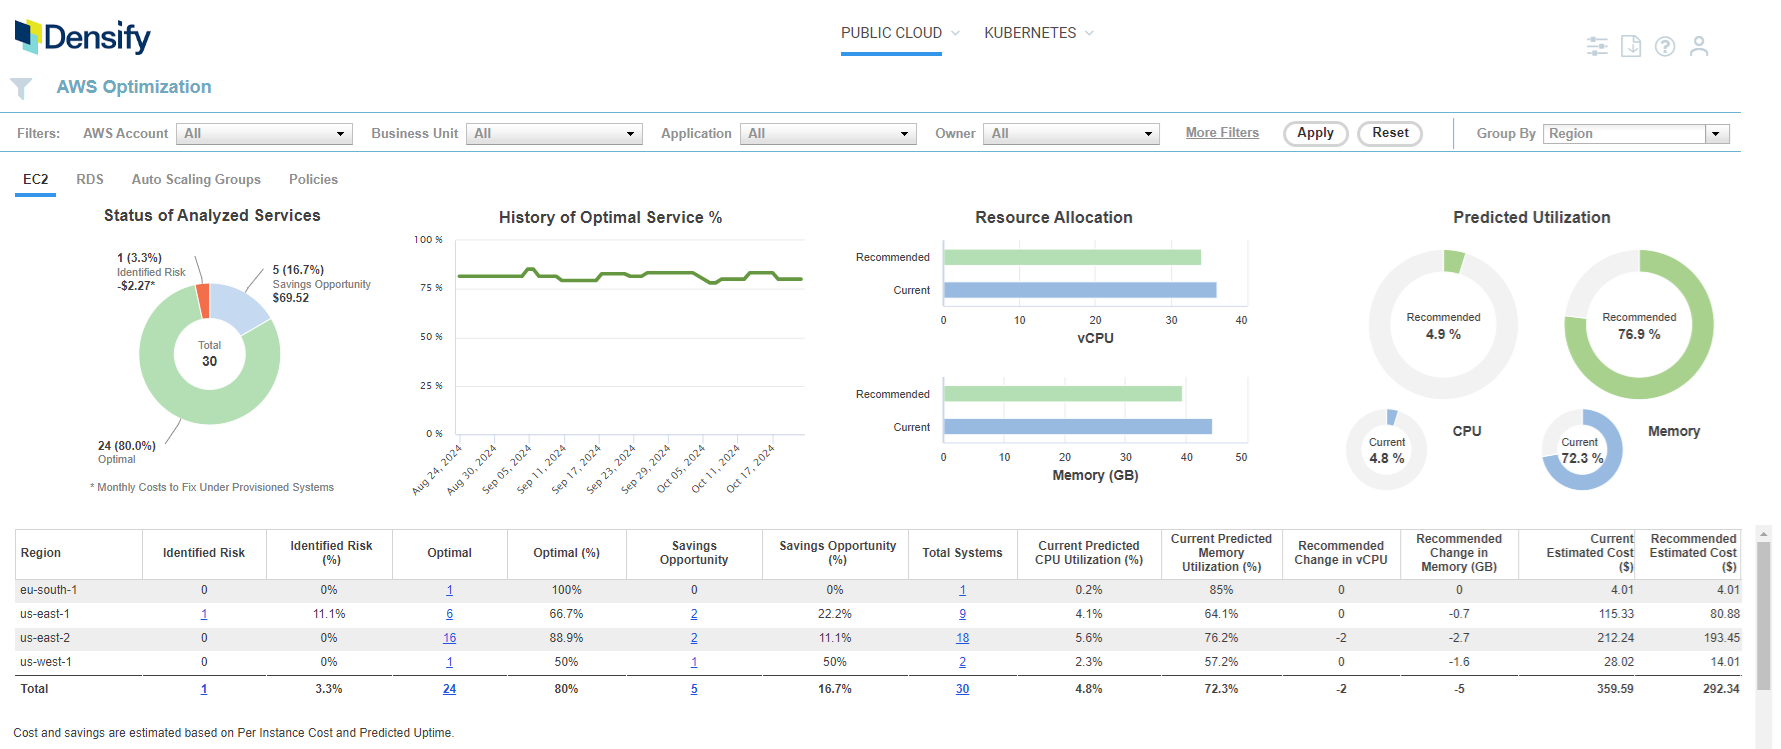
These tabular reports are grouped by your selection in the Group By dropdown list at the top of the page. See [Using the Group By Feature](./Using_the_Group_By_Feature);

### Overview of the Top Pane

<Accordion title="Table: Public Cloud Optimization Charts and Graphs">
  <table>
    <col />

    <col />

    <col />

    <thead>
      <tr>
        <th>
          <p>Chart Name </p>
        </th>

        <th>
          <p>Description</p>
        </th>

        <th>
          <p>Included in Reports</p>
        </th>
      </tr>
    </thead>

    <tbody>
      <tr>
        <td>
          <p>Status of Analyzed Services</p>
        </td>

        <td>
          <p><a name="kanchor240" />This pie chart provides a quick view of your EC2 instances size/family recommendations. </p>
          <p>You can use the Guest Filter to narrow the scope of your systems based on organizational attributes/tags/properties.</p>
          <p>You can use the <span class="mc-variable Document.FloatingFilterMenu variable">Recommendation Filter Menu</span> to focus on a specific set of instances. </p>
          <p>See <a class="RefToBookmarkNoPage MCXref xref xrefRefToBookmarkNoPage" href="./Viewing_the_Optimization_Overview_Report#Status_of_Serv"><u>Status of all Analyzed Services</u></a> for details of the pie slices.</p>
          <p>A footnote below the pie chart explains the negative value is actually the increased cost to resize instances that are at risk.</p>
        </td>

        <td>
          <ul>
            <li>AWS > EC2</li>
            <li>Azure > Virtual Machines</li>
            <li>GCP > Compute Engine</li>
          </ul>
        </td>
      </tr>

      <tr />

      <tr>
        <td>
          <p>History of Optimal Services (%)</p>
        </td>

        <td>
          <p>The line chart  shows the number of instances that are sized correctly over time. For each date, optimal service percentage is calculated as the ratio of (the number of systems that are sized correctly) divided by (the total number of systems, defined by the set of filters on that day). The axis scales based on the amount of data up to the maximum of 6 months. If you hover over any data point in the graph a popup indicates the percentage of systems that are "Just Right" on the selected date. As you apply the recommendations, the number of right-sized instances should increase over time. </p>
          <p class="CiRBATableNote" data-mc-autonum="<b>Note: </b>"><span class="autonumber"><span><b>Note: </b></span></span>Systems with 'No Data' are not included in these counts.</p>
        </td>

        <td>
          <ul>
            <li>AWS > EC2</li>
            <li>Azure > Virtual Machines</li>
            <li>GCP > Compute Engine</li>
          </ul>
        </td>
      </tr>

      <tr />

      <tr>
        <td>
          <p>Resource Allocation</p>
        </td>

        <td>
          <p> This bar chart shows the current settings and the recommended settings for both CPU and memory. Values are aggregated to show the total increase or decrease of required resources for the selected scope of systems. </p>
          <p>In this chart, the values are converted automatically to the next larger or smaller unit, so that values are easy to read:</p>

          <ul>
            <li>MB > GB > TB > PB (each step is divided by 1,024);</li>
            <li>mCores > Cores> KCores > MCores (each step is divided 1,000).</li>
          </ul>
        </td>

        <td>
          <ul>
            <li>AWS > EC2</li>
            <li>Azure > Virtual Machines</li>
            <li>GCP > Compute Engine</li>
          </ul>
        </td>
      </tr>

      <tr>
        <td>
          <p>Predicted Utilization</p>
        </td>

        <td>
          <p>This pie chart shows the current settings and the recommended settings for both CPU and memory for predicted utilization.</p>
        </td>

        <td>
          <ul>
            <li>AWS > EC2</li>
            <li>Azure > Virtual Machines</li>
            <li>GCP > Compute Engine</li>
          </ul>
        </td>
      </tr>
    </tbody>
  </table>
</Accordion>

### Overview of the Lower Pane

<Accordion title="Table: Public Cloud Optimization Tabular Report">
  <table>
    <col />

    <col />

    <col />

    <thead>
      <tr>
        <th>
          <p> Column Name </p>
        </th>

        <th>
          <p>Description</p>
        </th>

        <th>
          <p>Included in Reports</p>
        </th>
      </tr>
    </thead>

    <tbody>
      <tr>
        <td>
          <p>Assigned Dynamically <br />by Group By Selection</p>
        </td>

        <td>
          <p>This column is based on your selection in the <span>Group By</span> dropdown list.See <madcap:conditionaltext data-mc-conditions="CiRBA.ScreenOnly"><a class="MCXref xref" href="./Using_the_Group_By_Feature">Using the Group By Feature</a></madcap:conditionaltext>;</p>
          <p>You must tag your instances and then map your cloud resource tags to <span class="mc-variable Document.Company variable">Densify</span> attributes so the tags will be included in the analyses. Contact <span class="mc-variable Document.Support variable"><a class="__cf_email__" data-cfemail="fdae888d8d928f89bdb998938e949b84d39e9290" href="/cdn-cgi/l/email-protection">\[email protected]</a></span> for details..</p>
        </td>

        <td>
          <ul>
            <li>AWS > EC2</li>
            <li>Azure > Virtual Machines</li>
            <li>GCP > Compute Engine</li>
          </ul>
        </td>
      </tr>

      <tr>
        <td>
          <p>Identified Risk</p>
        </td>

        <td>
          <p>This column indicates the number of instances that are at risk for the selected application. These instances do not have adequate resources to run the application effectively. The value is displayed as a hyperlink, allowing you to drill down to the detailed report.</p>
        </td>

        <td>
          <ul>
            <li>AWS > EC2</li>
            <li>Azure > Virtual Machines</li>
            <li>GCP > Compute Engine</li>
          </ul>
        </td>
      </tr>

      <tr>
        <td>
          <p>Identified Risk (%)</p>
        </td>

        <td>
          <p>This column contains the number of instances that are at risk as a percentage of the total number of instances that are running the selected application, or are associated with the defined grouping tag/attribute.</p>
        </td>

        <td>
          <ul>
            <li>AWS > EC2</li>
            <li>Azure > Virtual Machines</li>
            <li>GCP > Compute Engine</li>
          </ul>
        </td>
      </tr>

      <tr>
        <td>
          <p>Optimal</p>
        </td>

        <td>
          <p>This column indicates the number of instances that are sized correctly for the selected application. These instance have adequate resources to run the application effectively. The value is not displayed as a hyperlink. </p>
        </td>

        <td>
          <ul>
            <li>AWS > EC2</li>
            <li>Azure > Virtual Machines</li>
            <li>GCP > Compute Engine</li>
          </ul>
        </td>
      </tr>

      <tr>
        <td>
          <p>Optimal (%)</p>
        </td>

        <td>
          <p>This column contains the number of instances that are at sized correctly as a percentage of the total number of instances that are running the selected application, or are associated with the defined grouping tag/attribute.</p>
        </td>

        <td>
          <ul>
            <li>AWS > EC2</li>
            <li>Azure > Virtual Machines</li>
            <li>GCP > Compute Engine</li>
          </ul>
        </td>
      </tr>

      <tr>
        <td>
          <p>Savings Opportunity</p>
        </td>

        <td>
          <p>These instances can be terminated, reduced in size or changed to a modernized instance and can still run effectively. The value is displayed as a hyperlink, allowing you to drill down to the detailed report.</p>
        </td>

        <td>
          <ul>
            <li>AWS > EC2</li>
            <li>Azure > Virtual Machines</li>
            <li>GCP > Compute Engine</li>
          </ul>
        </td>
      </tr>

      <tr>
        <td>
          <p>Savings Opportunity (%)</p>
        </td>

        <td>
          <p>This column contains the number of over-sized instances as a percentage of the total number of instances that are running the selected application, or are associated with the defined grouping tag/attribute.</p>
        </td>

        <td>
          <ul>
            <li>AWS > EC2</li>
            <li>Azure > Virtual Machines</li>
            <li>GCP > Compute Engine</li>
          </ul>
        </td>
      </tr>

      <tr>
        <td>
          <p><a name="Reviewing_Count" />Total Systems</p>
        </td>

        <td>
          <p>The number of instances listed in this column is a hyperlink that takes you to the <span class="mc-variable Document.Instance_Optimization_Details variable">Instance Optimization Details</span> page for the selected  group. For more information, see <madcap:conditionaltext data-mc-conditions="CiRBA.ScreenOnly"><a class="MCXref xref" href="./Understanding_the_Instance_Details_Report">Understanding the Instance Optimization Details Report</a></madcap:conditionaltext>.</p>
        </td>

        <td>
          <ul>
            <li>AWS > EC2</li>
            <li>Azure > Virtual Machines</li>
            <li>GCP > Compute Engine</li>
          </ul>
        </td>
      </tr>

      <tr>
        <td>
          <p><a name="Reviewing_CPU" />Current Predicted CPU Utilization (%)</p>
        </td>

        <td>
          <p> This is the weighted average value of the current CPU utilization percentage for this group of systems. </p>
        </td>

        <td>
          <ul>
            <li>AWS > EC2</li>
            <li>Azure > Virtual Machines</li>
            <li>GCP > Compute Engine</li>
          </ul>
        </td>
      </tr>

      <tr>
        <td>
          <p><a name="Reviewing_Memory" />Current Predicted Memory Utilization (%)</p>
        </td>

        <td>
          <p> This is the weighted average value of the current memory utilization percentage for this group of systems. </p>
        </td>

        <td>
          <ul>
            <li>AWS > EC2</li>
            <li>Azure > Virtual Machines</li>
            <li>GCP > Compute Engine</li>
          </ul>
        </td>
      </tr>

      <tr>
        <td>
          <p>Recommended Change in vCPU</p>
        </td>

        <td>
          <p> This is the change in allocated vCPUs, from what is currently allocated to the value that <span class="mc-variable General.ProductName variable">Densify</span> recommends for this group of systems. </p>
          <p>The value displayed here is the sum total of (recommended - current vCPU) of all systems in this group.</p>
        </td>

        <td>
          <ul>
            <li>AWS > EC2</li>
            <li>Azure > Virtual Machines</li>
            <li>GCP > Compute Engine</li>
          </ul>
        </td>
      </tr>

      <tr>
        <td>
          <p>Recommended Change in Memory (GB)</p>
        </td>

        <td>
          <p> This is the change in allocated memory, from what is currently allocated to the value that <span class="mc-variable General.ProductName variable">Densify</span> recommends for this group of systems. </p>
          <p>The value displayed here is the sum total of (recommended - current GB) of all systems in this group.</p>
        </td>

        <td>
          <ul>
            <li>AWS > EC2</li>
            <li>Azure > Virtual Machines</li>
            <li>GCP > Compute Engine</li>
          </ul>
        </td>
      </tr>

      <tr>
        <td>
          <p><a name="Reviewing_EstimatedCost" />Current Estimated Cost (\$)</p>
        </td>

        <td>
          <p> This is the estimated cost for this this group of systems, based on the current instance sizing. The cost is calculated by adding the current estimated cost of each instance in the group. See  <madcap:conditionaltext data-mc-conditions="CiRBA.ScreenOnly"><a class="RefToBookmarkNoPage MCXref xref xrefRefToBookmarkNoPage" href="./Understanding_the_Instance_Details_Report#Details_EstimatedCost"><u>Current Estimated Cost (\$)</u></a> in the <span class="mc-variable Document.Instance_Optimization_Details variable">Instance Optimization Details</span> report</madcap:conditionaltext>.</p>
        </td>

        <td>
          <ul>
            <li>AWS > EC2</li>
            <li>Azure > Virtual Machines</li>
            <li>GCP > Compute Engine</li>
          </ul>
        </td>
      </tr>

      <tr>
        <td>
          <p>Recommended Estimated Cost (\$)</p>
        </td>

        <td>
          <p> This is the estimated cost for this group of systems, based on the recommended instance sizing. The cost is calculated  by adding all the recommended estimated cost of each instance in the group. </p>
          <p>See <madcap:conditionaltext data-mc-conditions="CiRBA.ScreenOnly"><a class="RefToBookmarkNoPage MCXref xref xrefRefToBookmarkNoPage" href="./Understanding_the_Instance_Details_Report#Details_RecEstimatedCost"><u>Recommended Estimated Cost (\$)</u></a> in the <span class="mc-variable Document.Instance_Optimization_Details variable">Instance Optimization Details</span> report</madcap:conditionaltext>.</p>
        </td>

        <td>
          <ul>
            <li>AWS > EC2</li>
            <li>Azure > Virtual Machines</li>
            <li>GCP > Compute Engine</li>
          </ul>
        </td>
      </tr>

      <tr>
        <td>
          <p>\$ Savings/Month</p>
        </td>

        <td>
          <p> This is the difference between the current and recommended cost. (current estimated cost - recommended estimated cost). </p>
        </td>

        <td>
          <ul>
            <li>AWS > EC2</li>
            <li>Azure > Virtual Machines</li>
            <li>GCP > Compute Engine</li>
          </ul>
        </td>
      </tr>

      <tr>
        <td>
          <p>Totals</p>
        </td>

        <td>
          <p>A row at the bottom of the table provides totals for each column. You may need to scroll down through the report to see the totals if your report is long. </p>
          <p>Columns with the number of instances are provided as hyperlinks when the value is greater than 0. The link takes you to the Instance Optimization Details report. See <madcap:conditionaltext data-mc-conditions="CiRBA.ScreenOnly"><a class="MCXref xref" href="./Understanding_the_Instance_Details_Report">Understanding the Instance Optimization Details Report</a></madcap:conditionaltext>.</p>
          <p>If your reports spans multiple pages, the total listed here is for the current page only. Each page will have its own total for each column. </p>
        </td>

        <td>
          <ul>
            <li>AWS > EC2Instances</li>
            <li>Azure > Virtual Machines</li>
            <li>GCP > Compute Engine</li>
          </ul>
        </td>
      </tr>

      <tr>
        <td>
          <p><a name="Reviewing_Footnote" />Footnote</p>
        </td>

        <td>
          <p>A footnote at the bottom of this report indicates the estimated costs are based on the instance cost and the predicted uptime.</p>
        </td>

        <td>
          <ul>
            <li>AWS > EC2Instances</li>
            <li>Azure > Virtual Machines</li>
            <li>GCP > Compute Engine</li>
          </ul>
        </td>
      </tr>
    </tbody>
  </table>
</Accordion>

### Other Features of the Tabular Report

A row at the bottom of the table provides totals for each column. You may need to scroll down through the report to see the totals if your the report is long. Columns that report on the number of instances are provided as hyperlinks when the value is greater than 0. The link takes you to the Instance Optimization Details report. See [Understanding the Instance Optimization Details Report](./Understanding_the_Instance_Details_Report).

A footnote at the bottom of this report indicates the estimated costs are based on the instance cost and the predicted uptime.

## Grouping and Filtering Options

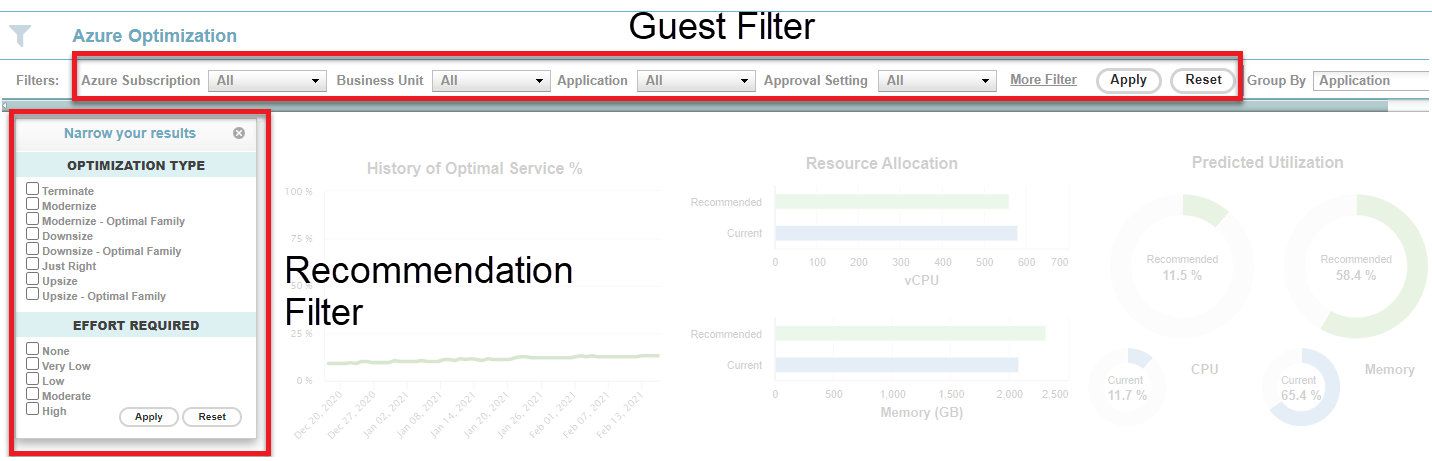
You can filter the optimization opportunity reports by instances and instance attributes, as well as by recommendations.

<Accordion title="Figure: Accessing Grouping and Filtering Options ">
  <Frame>
    <img src="https://mintcdn.com/densify/uni34QsYZOpuZ7St/images/docs/WebHelp_Densify_Cloud/Content/Resources/Images/Cirba_SaaS/03000111.png?fit=max&auto=format&n=uni34QsYZOpuZ7St&q=85&s=7cf620d406a05e720261785bf421a573" alt="" width="1432" height="461" data-path="images/docs/WebHelp_Densify_Cloud/Content/Resources/Images/Cirba_SaaS/03000111.png" />
  </Frame>
</Accordion>

<Note>
  The global filter is not applicable to the cloud optimization opportunities dashboards and is not accessible on these pages.
</Note>

### Filtering by Instance Attributes

You can filter instances using a set of attributes (e.g. Business Unit, Application).

This type of filtering is supported on the optimization opportunities dashboard tabs, as well as the Instance Optimization Details page when navigating from the Count column. The guest filters selected are persistent across platforms for those pages that support the guest filters (i.e. guest filters selected for AWS EC2 will apply to the AWS RDS, AWS Spot Instances, as well as the AWS Instance Optimization Details reports).

For details, see [Using the Guest Filter](./Using_Guest_Filters).

### Grouping Data by Instance Attributes

The Group By option allows you to group results by properties and tags. Your selection defines the structure of various tabular reports.

<Accordion title="Video: Investigating Optimization Recommendations by Application">
  <iframe allowfullscreen="allowfullscreen" class="vidyard_iframe" frameborder="0" height="360" mozallowfullscreen="mozallowfullscreen" msallowfullscreen="msallowfullscreen" oallowfullscreen="oallowfullscreen" src="https://player.vimeo.com/video/494121314" webkitallowfullscreen="webkitallowfullscreen" width="630" />
</Accordion>

For details, see [Using the Group By Feature](./Using_the_Group_By_Feature).

### Filtering by Recommendation

You can filter instances based on recommendations using the Recommendation Filter Menu. This filter allows you to narrow the results of your optimization reports based on recommended optimization type, effort required, monetary impact, and service characteristics.

For details, see [Using the Recommendation Filter Menu](./Using_the_Recommendation_Filter_Menu).

Filtering by Recommendation

## Exporting Tabular Report

Once you have defined the filters to view a specific set of systems you can export the tabular view for external analysis.

Click the Export to Excel icon in the top right corner of the screen. See [Exporting Report Data](./Exporting_Report_Data) for details.