> ## Documentation Index
> Fetch the complete documentation index at: https://docs.kubex.ai/llms.txt
> Use this file to discover all available pages before exploring further.

# Automation Tab

export const InlineImageWithText = ({src, href, children, width = 80, caption}) => {
  return <span className="inline-flex items-center gap-3 align-middle">
            <a href={href} className="inline-block border-b-0">
                <Frame caption={caption}>
                    <img src={src} alt="" className="object-contain align-middle " width={width} style={{
    minWidth: width
  }} />
                </Frame>
            </a>
            <span className="align-middle">{children}</span>
        </span>;
};

<InlineImageWithText src="/images/docs-kubex/Content/Kubex/03000199.png">
  The automation features allow you to optimize your Kubernetes pods based on Kubex recommendations, ensuring resources are effectively allocated for improved performance and cost efficiency. See <a href="/docs-kubex/Content/Kubex/Automation_Overview">Automation Overview</a> for more information and the <a href="https://github.com/densify-dev/helm-charts/blob/master/charts/kubex-automation-engine/README.md">Kubex Automation Engine</a> in GitHub for deployment details and <a href="https://github.com/densify-dev/helm-charts/blob/master/charts/kubex-automation-engine/CHANGELOG.md">release notes</a>.
</InlineImageWithText>

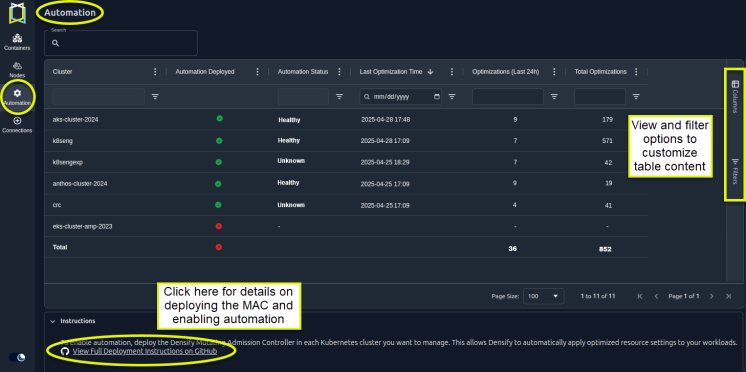
This page shows the status of the automation process.

<Frame caption="Figure: Automation Tab">
  <img src="https://mintcdn.com/densify/JV3F9NQeWJDSttAM/images/docs-kubex/Content/Kubex/03000200_746x372.png?fit=max&auto=format&n=JV3F9NQeWJDSttAM&q=85&s=d0b7ce3086070828ce69045049dffee9" alt="" width="746" height="372" data-path="images/docs-kubex/Content/Kubex/03000200_746x372.png" />
</Frame>

See [Using Table Column Features](/docs-kubex/Content/Kubex/Using_Table_Column_Features) for details on setting filters and customizing views of the table's content.

### Reviewing Automation Status

<Accordion title="Table: Automation Table">
  <table>
    <thead>
      <tr>
        <th>
          Column
        </th>

        <th>
          Description
        </th>
      </tr>
    </thead>

    <tbody>
      <tr>
        <td>
          Cluster
        </td>

        <td>
          The name of cluster.
        </td>
      </tr>

      <tr>
        <td>
          Automation Deployed
        </td>

        <td>
          The red or green icons indicate whether or not the Kubex Automation Engine has been deployed.
        </td>
      </tr>

      <tr>
        <td>
          Automation Status
        </td>

        <td>
          The status of the last automation attempt. The status will be one of the following:

          <ul>
            <li>Healthy--The cluster has been enabled for automation and is actively optimizing containers..</li>
            <li>Unknown--The Kubex Automation Engine has been deployed, but no mutations have occured in the last 24 hours</li>
          </ul>
        </td>
      </tr>

      <tr>
        <td>
          Last Optimization Time
        </td>

        <td>
          The date and time on which Kubex last attempted to optimize a manifest in the cluster.
        </td>
      </tr>

      <tr>
        <td>
          Optimizations (Last 24hrs)
        </td>

        <td>
          The number of times that Kubex has successfully optimized a manifest in the cluster, in the last 24 hours.
        </td>
      </tr>

      <tr>
        <td>
          Total Optimizations
        </td>

        <td>
          The total number of times that Kubex has successfully optimized a manifest on this cluster since it was first deployed.
        </td>
      </tr>
    </tbody>
  </table>
</Accordion>