- Kubex — Features & enhancements in the latest Kubex releases.
- Container Data Forwarder — Updates to Kubex’s Container data collection module.
- Kubex Automation Engine — Updates to Kubex’s Automation Engine module.
Kubex
This topic summarizes both new and updated features introduced in Kubex4.5.0 May 27, 2026
4.5.0 May 27, 2026
-
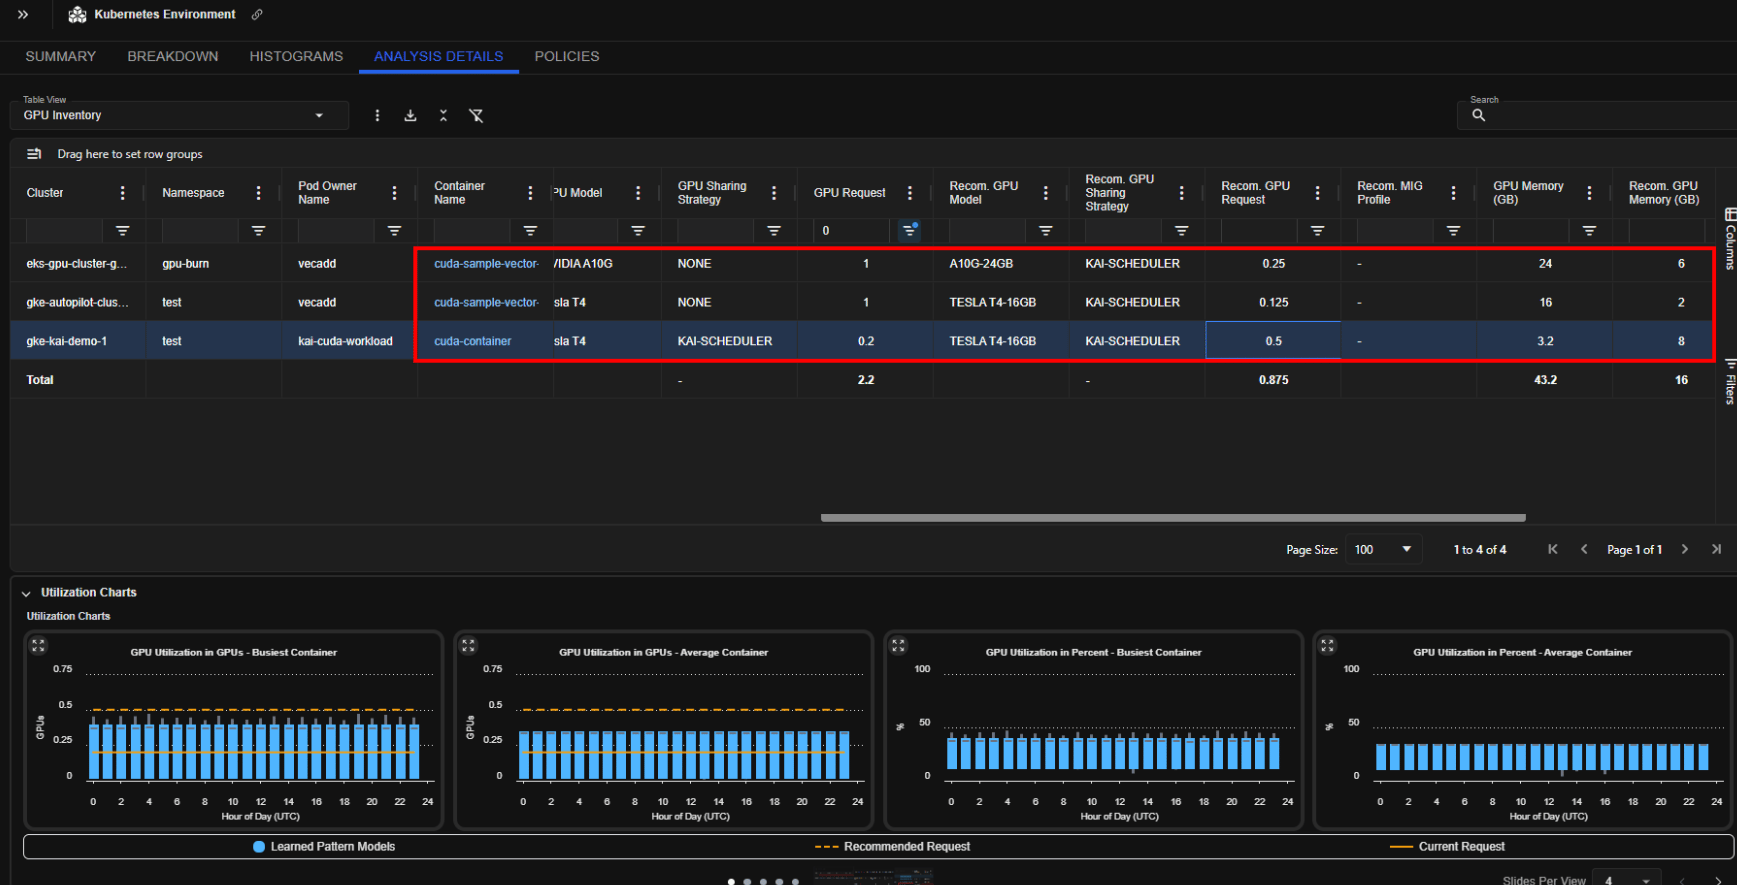
Fractional GPU Recommendations
- Fractional GPU recommendations on the current GPU model
-
GKE Autopilot Recommendations are Compute Class Aware
- Recognizes “balanced” and “general-purpose” compute classes and maintains the allowed CPU:Memory ranges
-
Guaranteed QoS Support
- Kubex recommendations support Guaranteed QoS
- This policy can be enforced (even if not currently setup) or auto-detected and maintained
-
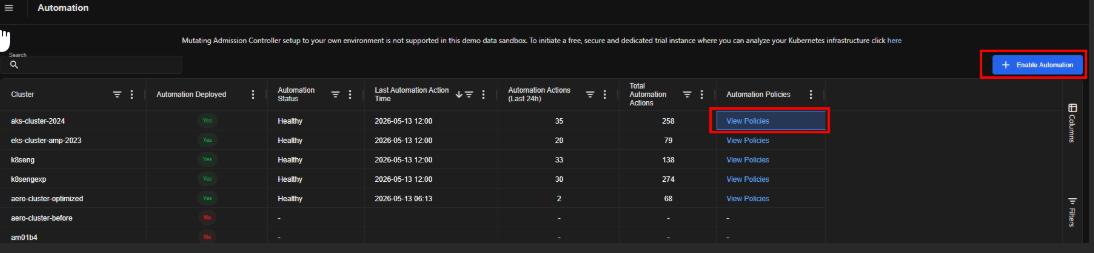
Container Automation Policy
- Visibility to the automation policy set up in the K8s cluster
- RBAC for AI Agent
4.4.0 April 29, 2026
4.4.0 April 29, 2026
-
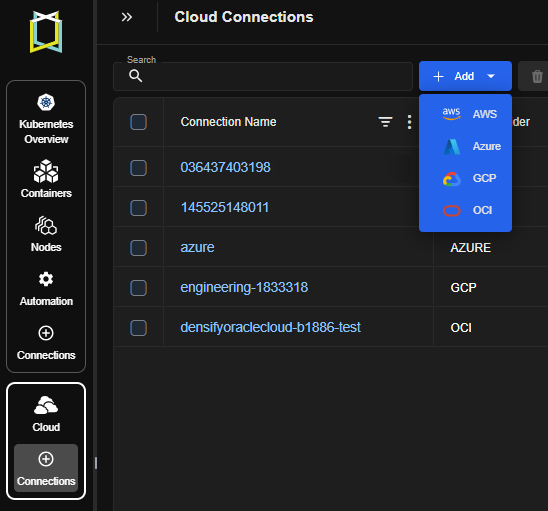
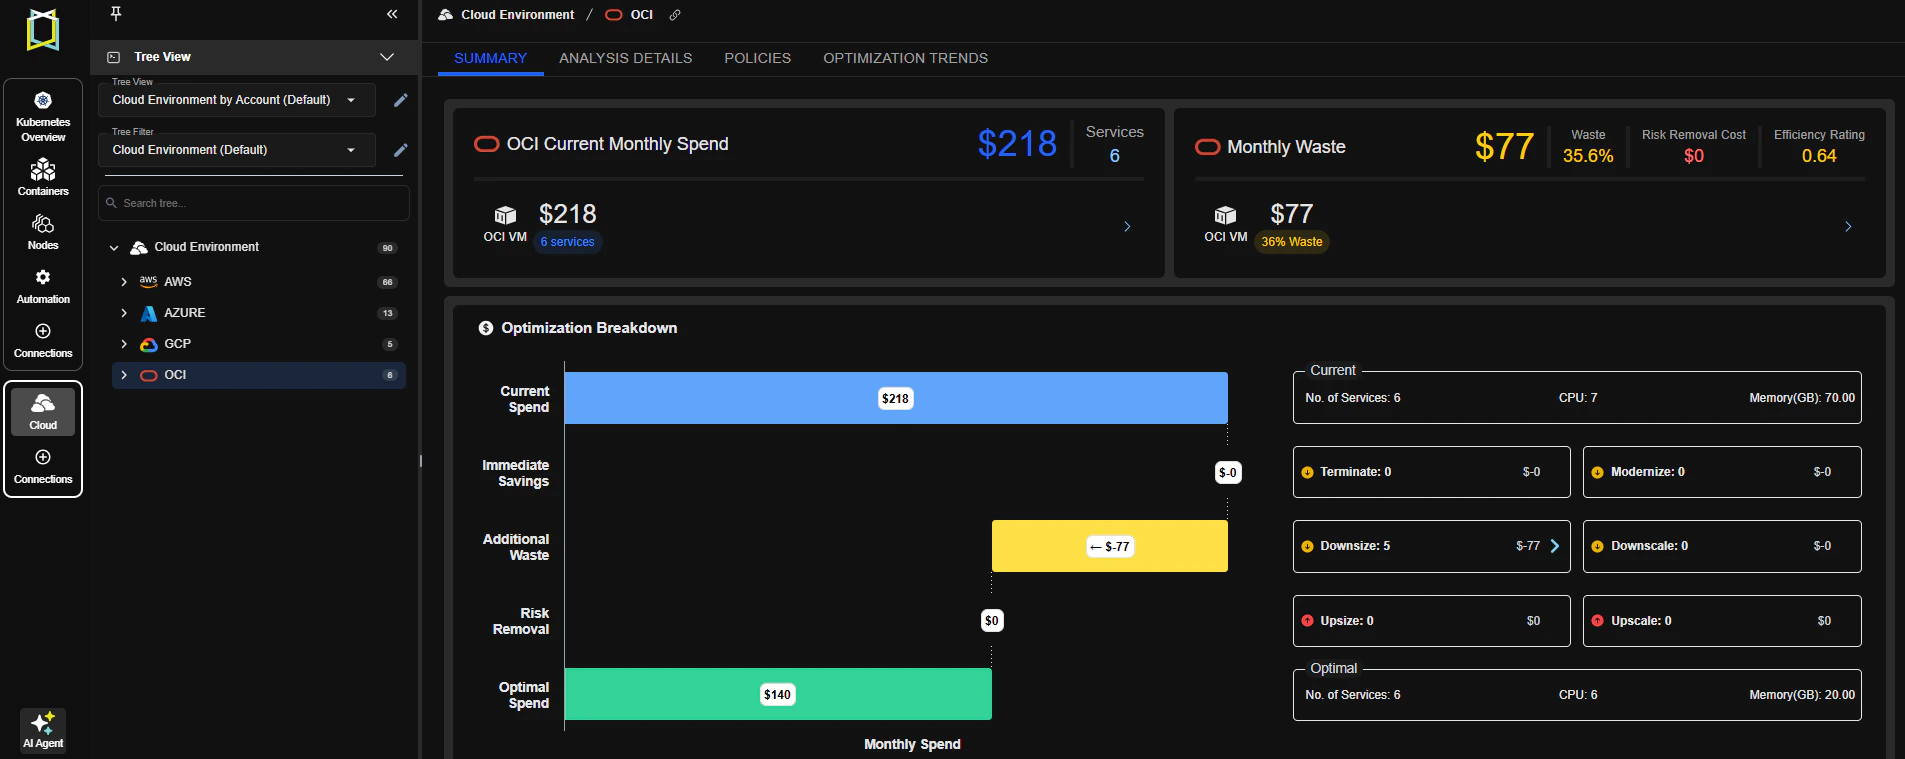
Oracle Cloud Infrastructure (OCI) Support
- Added support for OCI connections from the Cloud Connections page
- Enabled data collection and optimization for OCI Virtual Machines (VMs)
- Added support for App Owner report
-
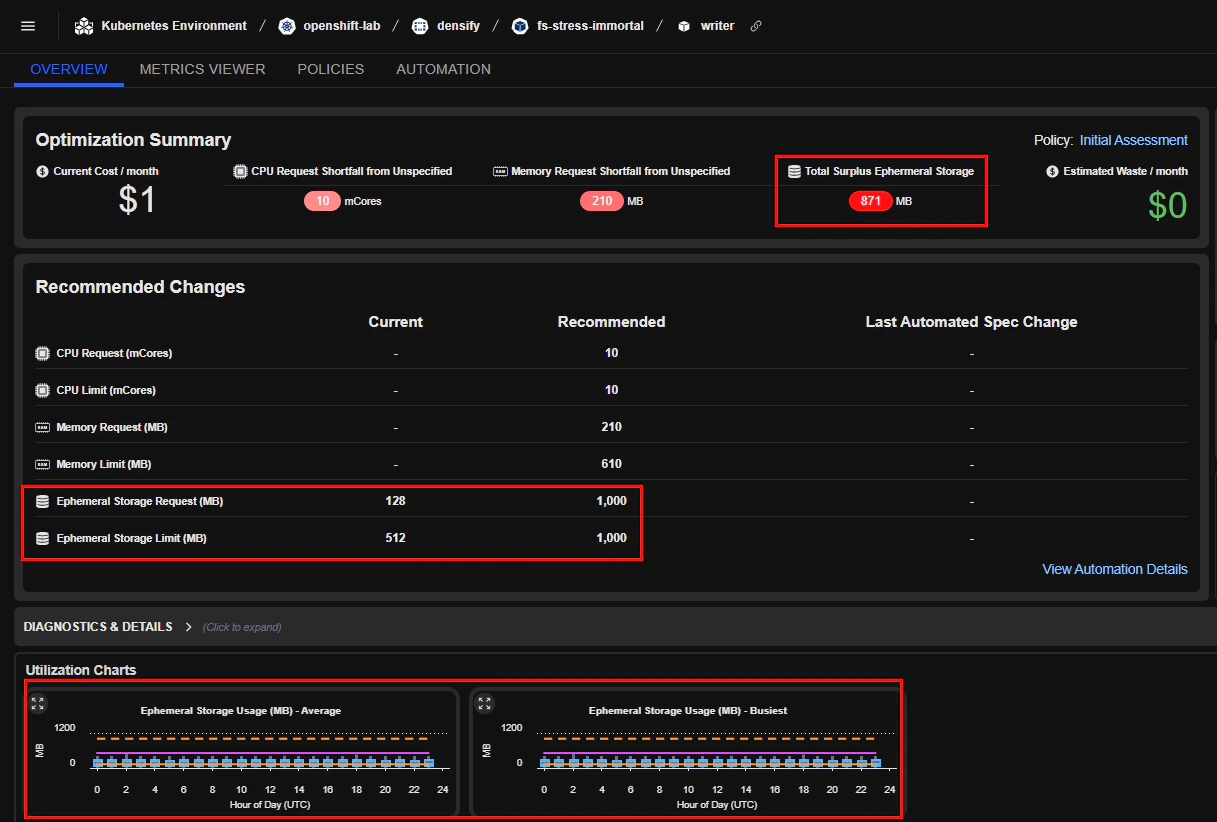
Container Ephemeral Storage Optimization
- Introduced ephemeral storage recommendations in the UI and REST API
- Added support for ephemeral storage policies
- Note: Ephemeral storage data collection is opt-in and disabled by default
-
Widget Enhancements
- Added GPU Trend widget to visualize GPU usage over time
- Added Prioritizer Insights widget to summarize recommended actions to focus on based on environment and preferences
-
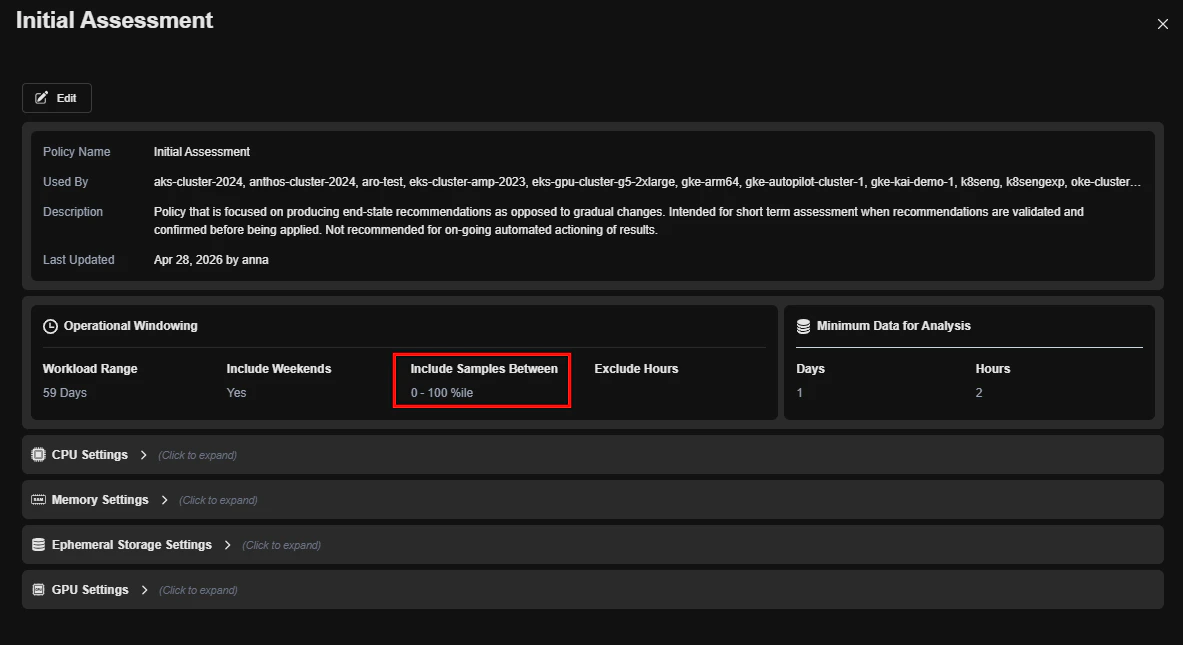
Policy Enhancements
- Improved Policy Viewer layout for readability and navigation
- Added support for configuring samples percentile in Container and Cloud policies
-
API Enhancements
- Added Automation Engine heartbeat endpoint:
POST /automation/clusters/{clusterName}/heartbeat
- Added Automation Engine heartbeat endpoint:
-
UI Improvements
- Added container cost visibility to the Container Overview page
- Enabled Edit and Delete functionality on the Cloud Connections page
-
Access Control & Security
- Added support for Okta Groups for permission management. Enabled assignment of user permissions based on group membership
- Added support for Microsoft Graph scopes (for example,
User.Read) in Azure OpenID integrations
4.2.0 March 11, 2026
4.2.0 March 11, 2026
-
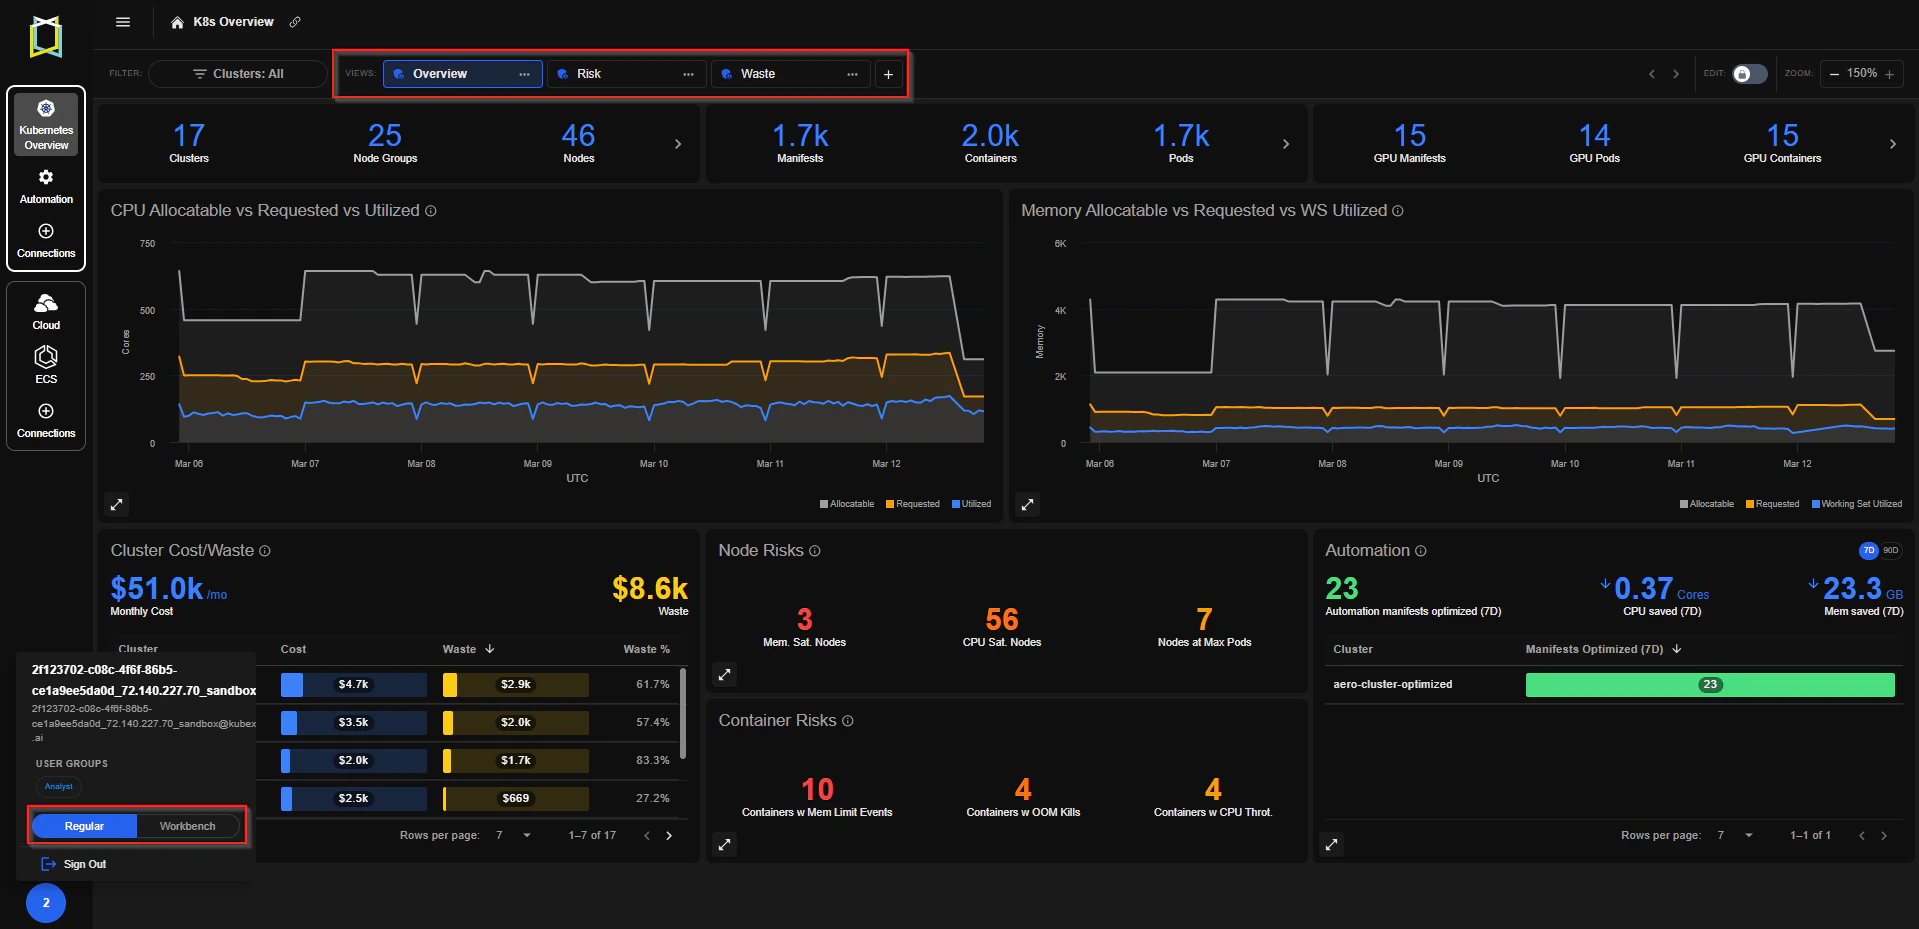
Kubernetes Dashboard
- Kubex introduces a new customizable dashboard that serves as the default landing page, enabling users to compose their own workspace using widgets for faster operational insights.
- The dashboard includes preconfigured views that organize key metrics and charts into ready-to-use layouts. Users can customize these views by arranging widgets and visualizations to match their operational workflow.
- Users can choose whether the classic interface or the new dashboard is used as their default landing page.
-
Improved Node and Container Visibility
- Container Details now displays node names instead of only a count.
- Horizontal Pod Autoscaler (HPA) settings are now visible in the Container Details table.
- Node group and node metrics now include 5-minute metric samples.
-
API Enhancements
- GPU recommendation details added to the Containers API endpoint
GET /kubernetes/clusters/<clusterName>/containers?details=true
- GPU recommendation details added to the Containers API endpoint
-
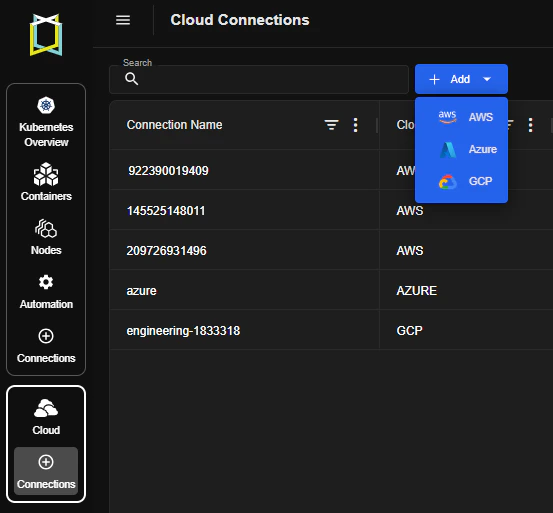
Google Cloud (GCP) Connection Support
- Kubex now supports Google Cloud Platform (GCP) connections directly from the Kubex UI.
-
AWS RDS Connection Data Support
- Kubex now collects and analyzes AWS RDS connection data, enabling deeper visibility into database activity and incorporating this data into platform analysis.
-
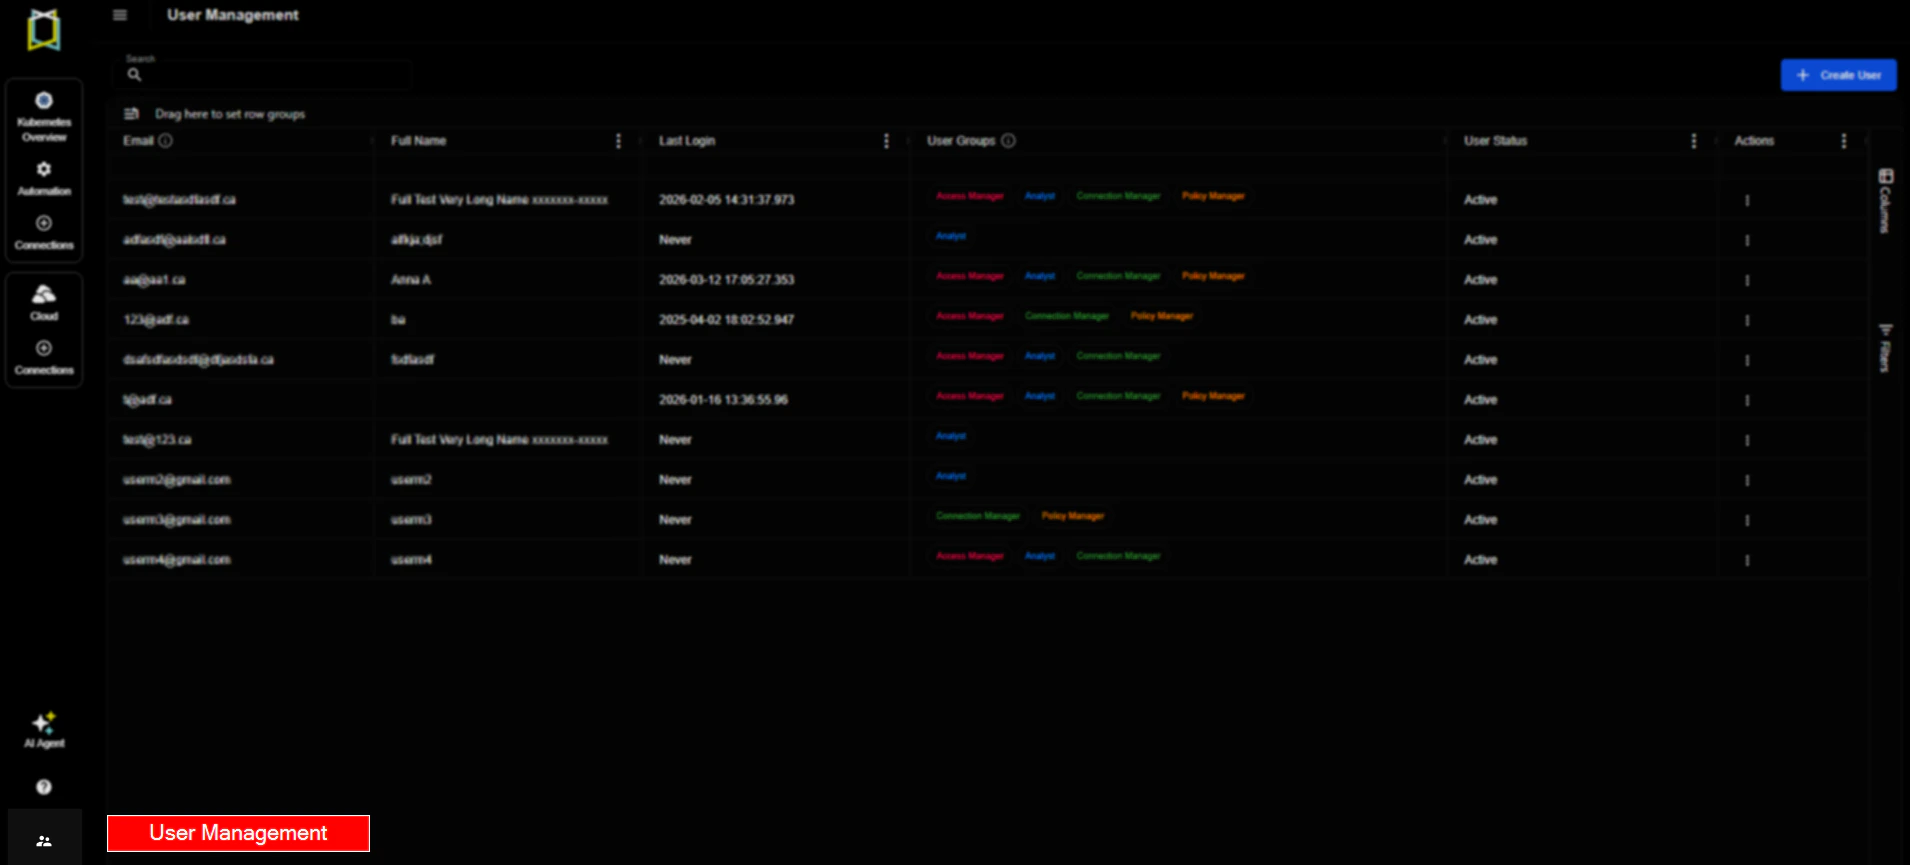
User Management
- Users in the Access Manager group can now access User Management
- Added sign-out functionality in the Kubex UI
-
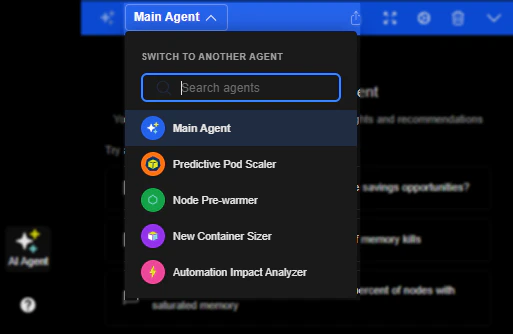
Multi AI-Agent Support
- Kubex now supports multiple AI agents, enabling users to switch between specialized agents for tasks such as predictive pod scaling, node pre-warming, container sizing, and automation impact analysis.
4.1.0 January 21, 2026
4.1.0 January 21, 2026
-
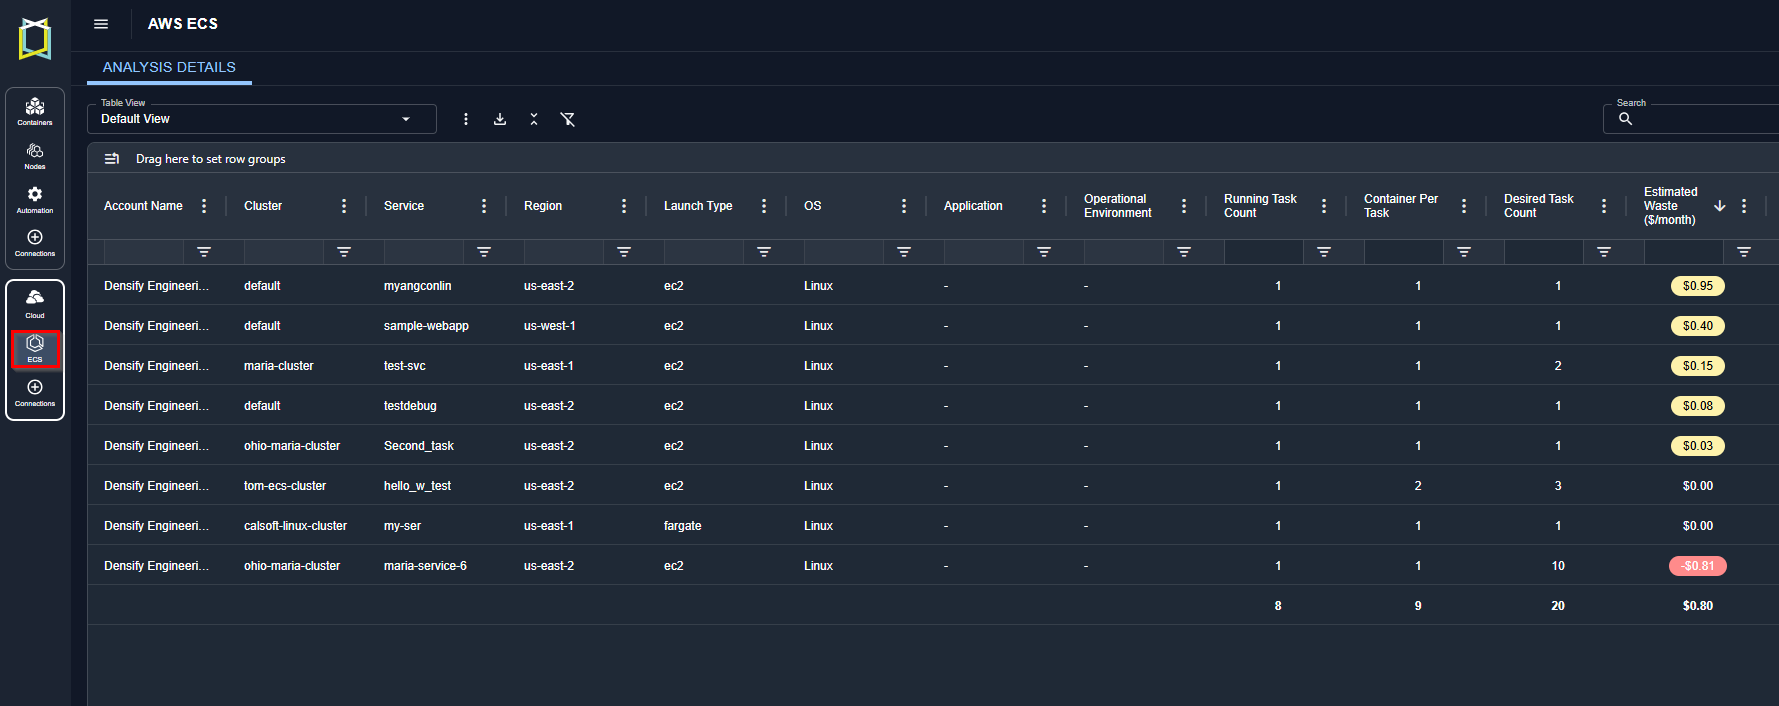
AWS ECS Support
- Kubex now shows optimization recommendations for Amazon ECS workloads, helping you right-size your containerized applications running on ECS for optimal performance and cost efficiency.
- The ECS button the left-hand menu only shows up if there is ECS data.
-
PKCE Support for SSO using OpenID
- PKCE (Proof Key for Code Exchange) is a security extension that enhances OAuth 2.0 authorization flows.
-
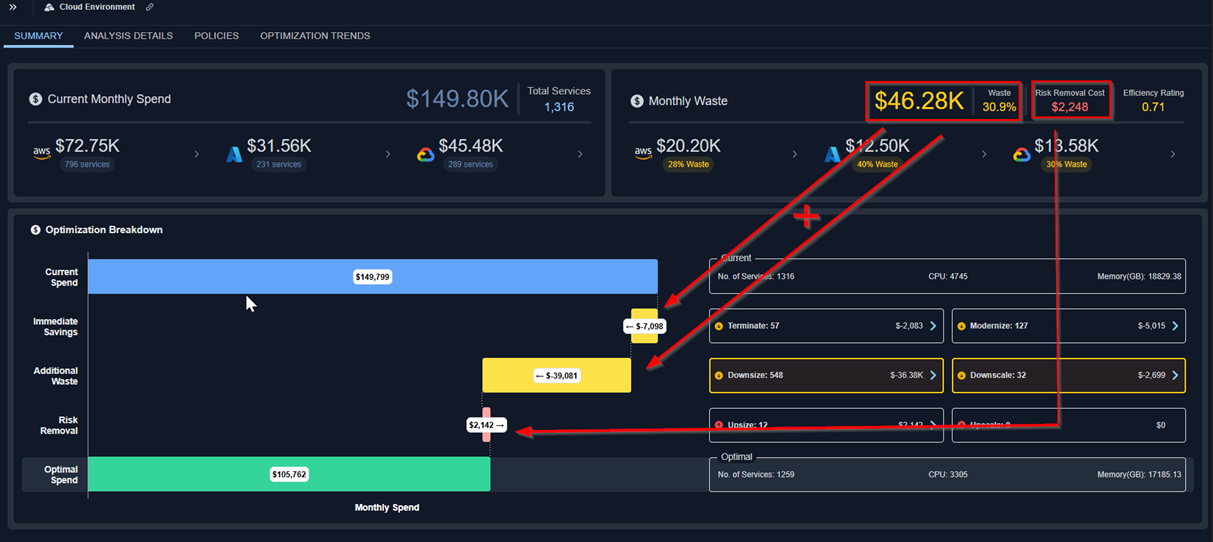
Cloud Summary Separates Waste and Risk
- Netting out Waste and Risk hides the true savings potential.
- By displaying ‘waste’ and ‘cost of risk removal’ as separate metrics, users can better understand each savings opportunity.
-
Node Group Cost on the Details table
- Node Group costs are displayed in the details table.
- Costs are calculated based on the sum of the costs of all nodes running in the node group. It takes into account the # of hours each node was running.
-
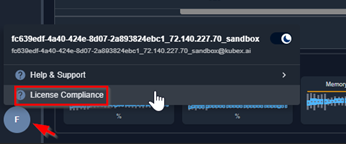
License Compliance Report
- The license compliance report has been migrated to the Kubex UI.
- The report shows how many Kubex licenses are being consumed against what is contractually allowed.
4.0.0 December 03, 2025
4.0.0 December 03, 2025
-
New Kubex AI Agent Experience
- Natural-Language Interaction: Users can now simply ask questions in plain English and get accurate, contextual answers directly from the AI agent.
- Guided Navigation: The agent can take users to the right features or pages in the product—no need to search menus or remember where things live.
- Action Assistance: Beyond answering questions, the agent can help surface relevant insights, and streamline everyday tasks.
- Enterprise-Grade Data Privacy: No customer data is used for model training. The underlying LLM does not learn from or use customer data to train or improve itself.
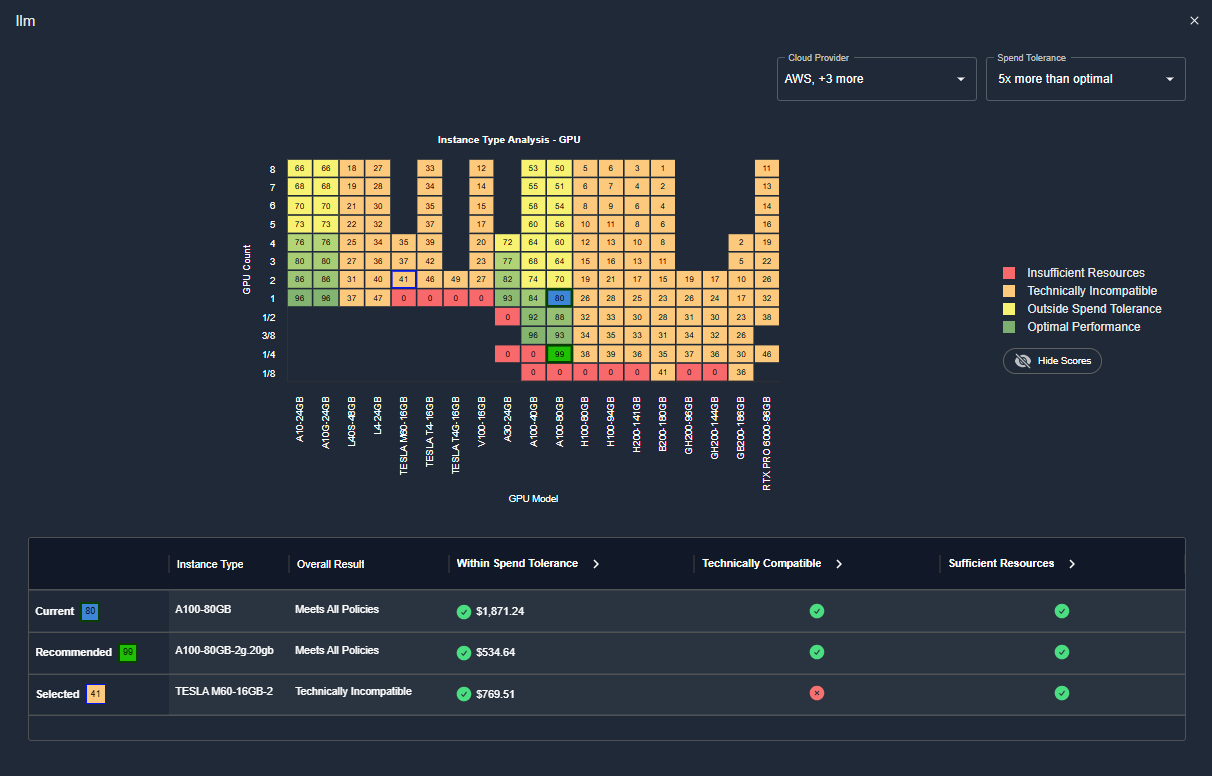
Enhanced GPU Analysis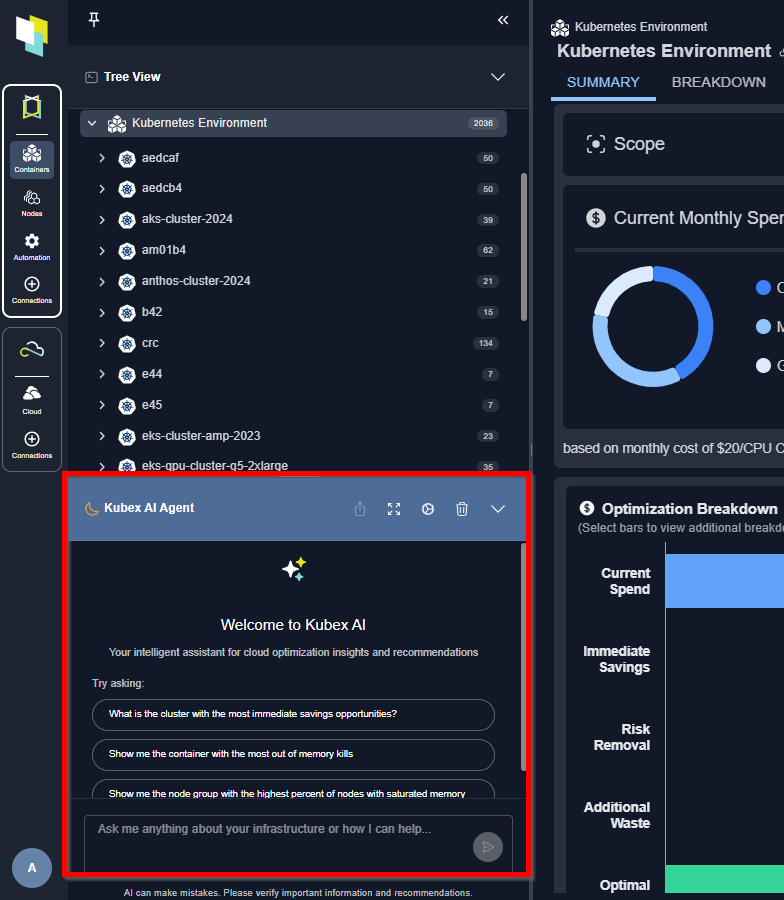
- The Kubex GPU analysis recommends the optimal GPU model and configuration for maximum potential savings. This includes alternative GPU models, provided they are compatible with the workload.
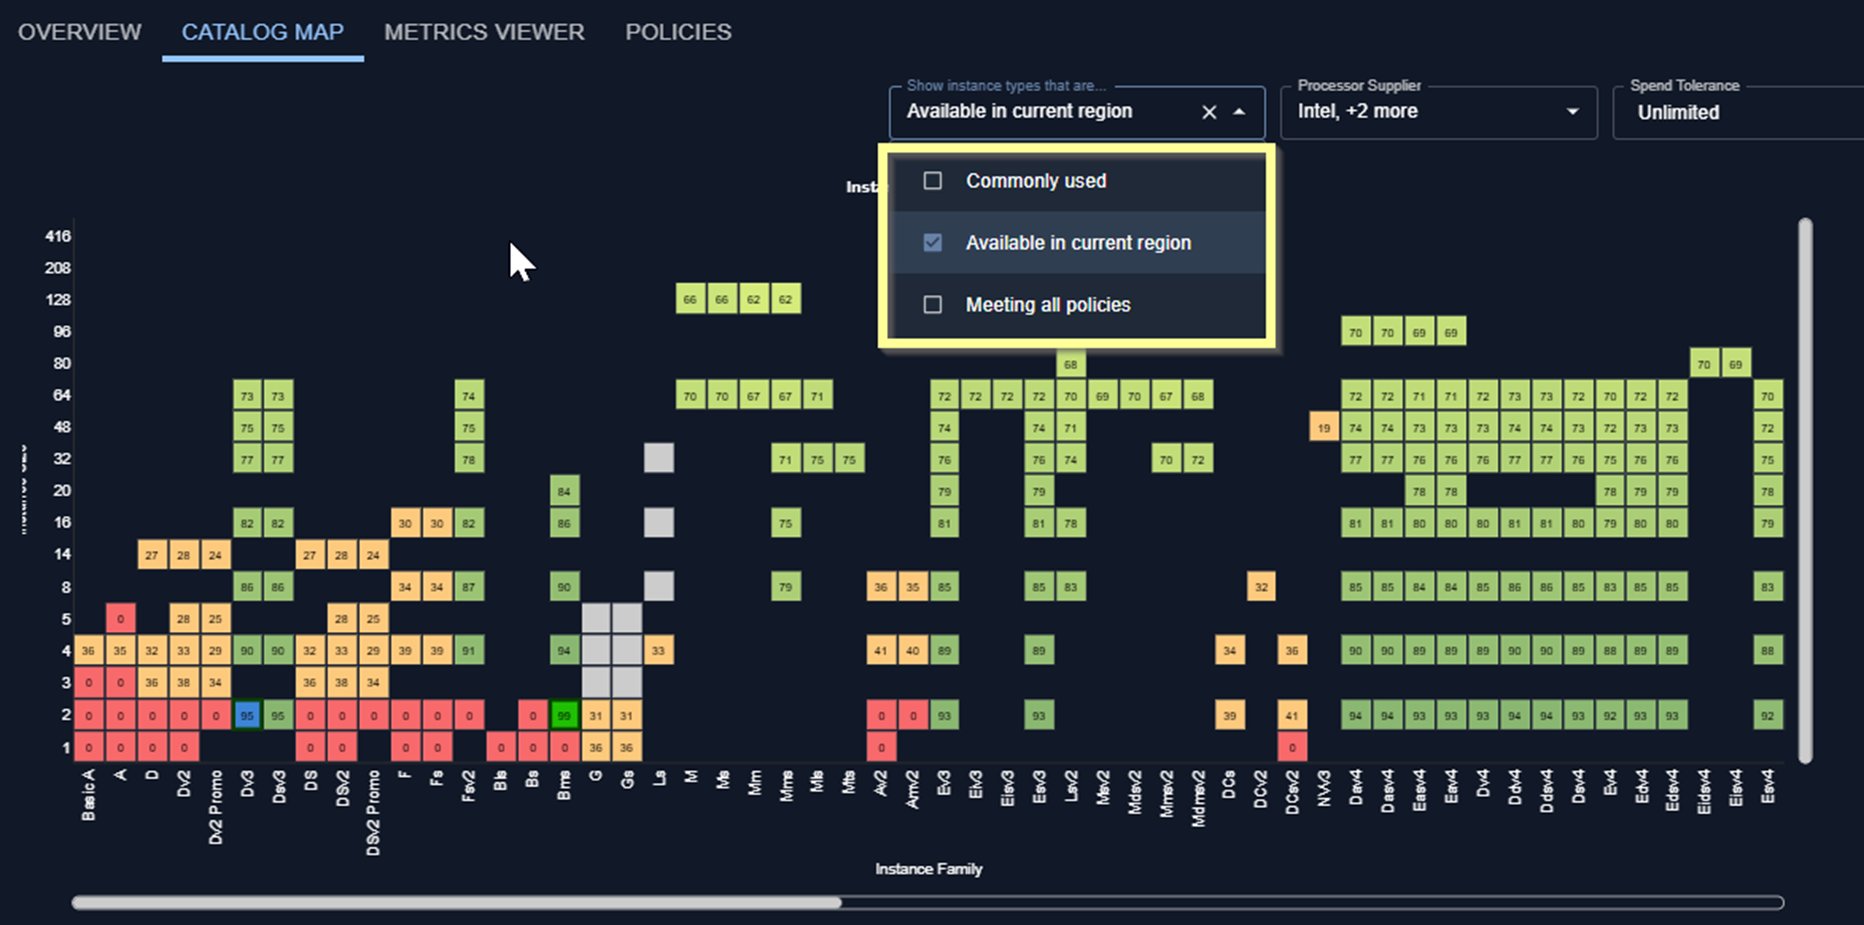
- The newly introduced GPU Catalog Map provides a visual comparison of how the current workload scores against all GPU models and configurations.
3.8.0 November 26, 2025
3.8.0 November 26, 2025
-
Policy Editing
- Version 3.8 includes a new and often requested capability to edit analysis policies via the UI.
- The “policy_admin” role enables specific users with the ability to edit both cloud and container analysis policy settings directly from the Kubex UI.
- Additionally, the last update date – and who made the update – are now exposed in the UI.
- The policy descriptions have been updated to make them easier to understand, and tooltips now include detailed information about each setting along with their default value.
Cloud Optimization Trends Improvements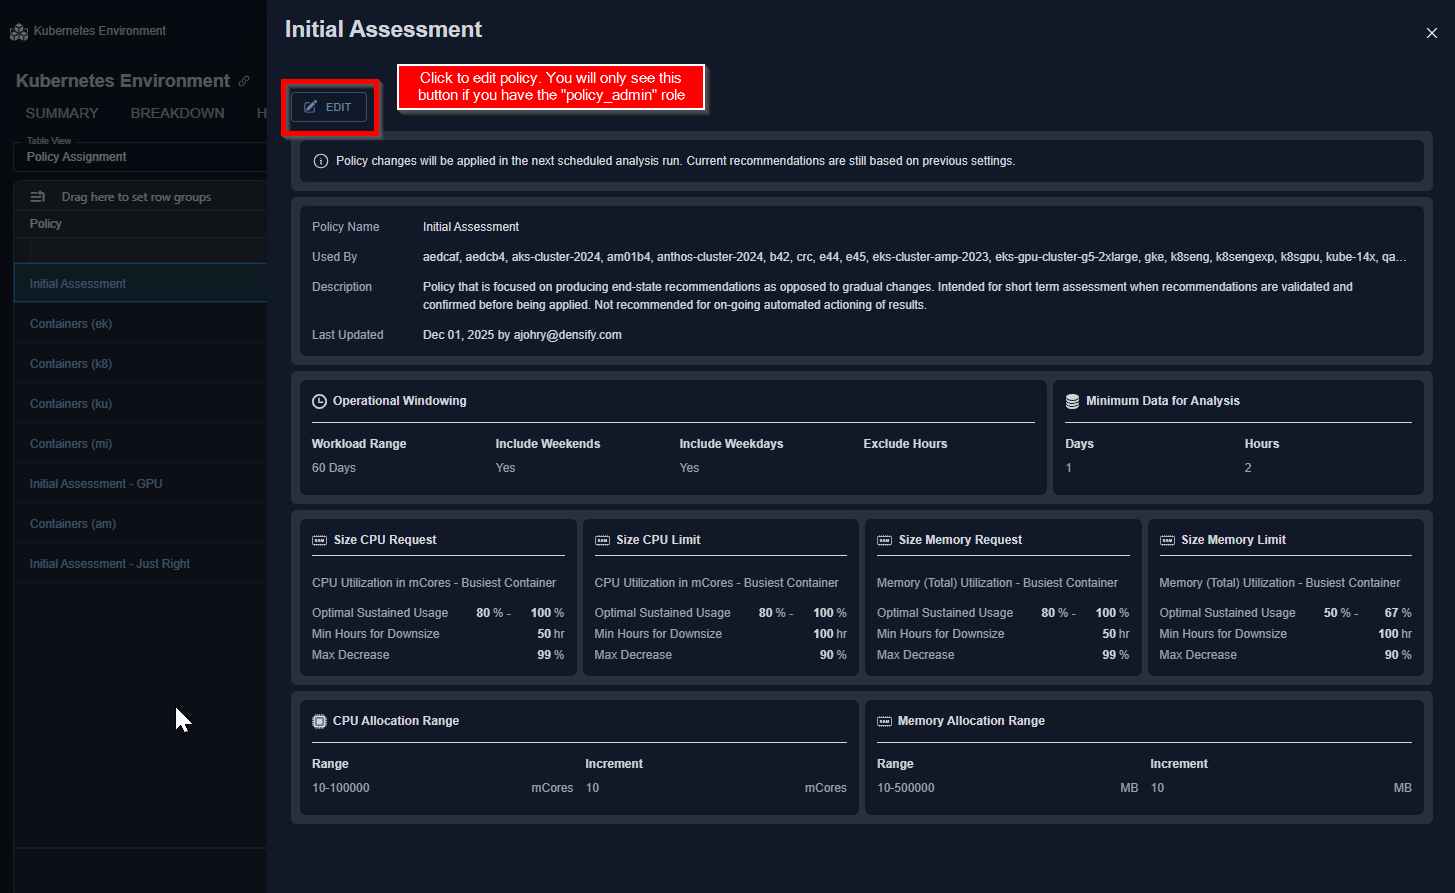
- The performance in loading and rendering the optimization trends charts located on the cloud Summary and Optimization Trends tabs has been significantly improved in this release.
- Kubex now supports data collection and analysis of containers running in GKE Autopilot Clusters providing visibility to container level risk and waste along with remediation recommendations for optimizing container resource allocations.
3.7.0 November 6, 2025
3.7.0 November 6, 2025
Updates to Container Optimization
Updates to Container Optimization
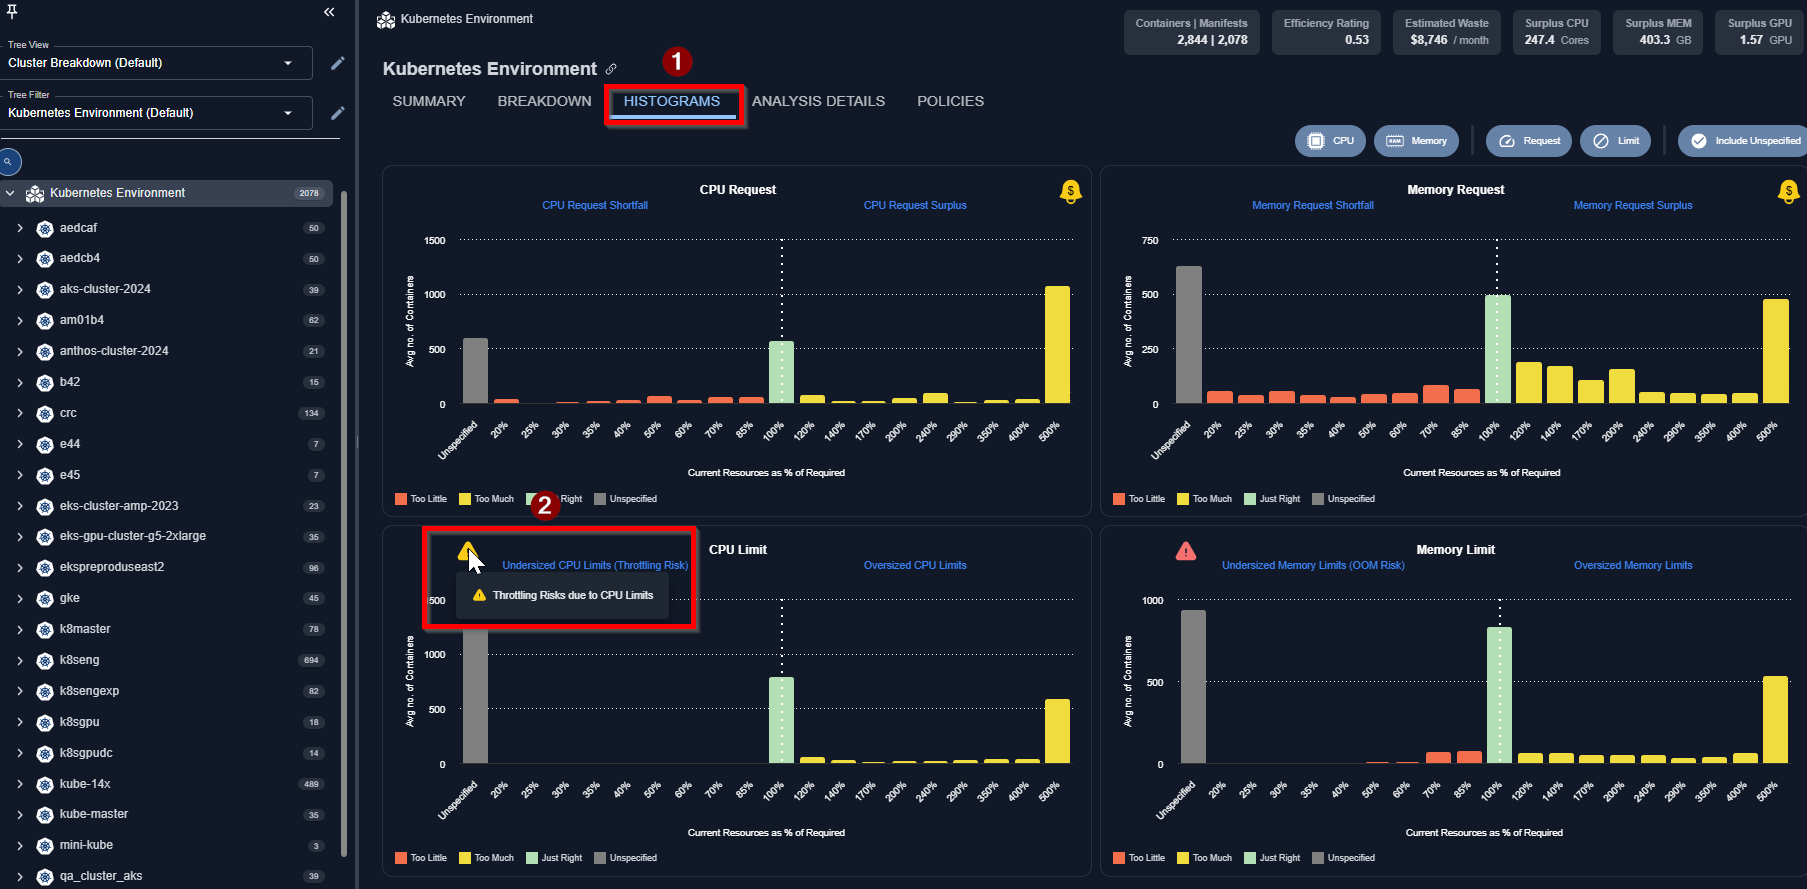
- CPU Throttling Risks
- The CPU Throttling risks due to undersized CPU Limits are highlighted in the Histogram.
- Clicking on the risk item (as shown below) will take you to the Analysis Details page showing all the containers with CPU Throttling risks, and the Kubex recommendation to address it.
Updates to Cloud Optimization
Updates to Cloud Optimization
-
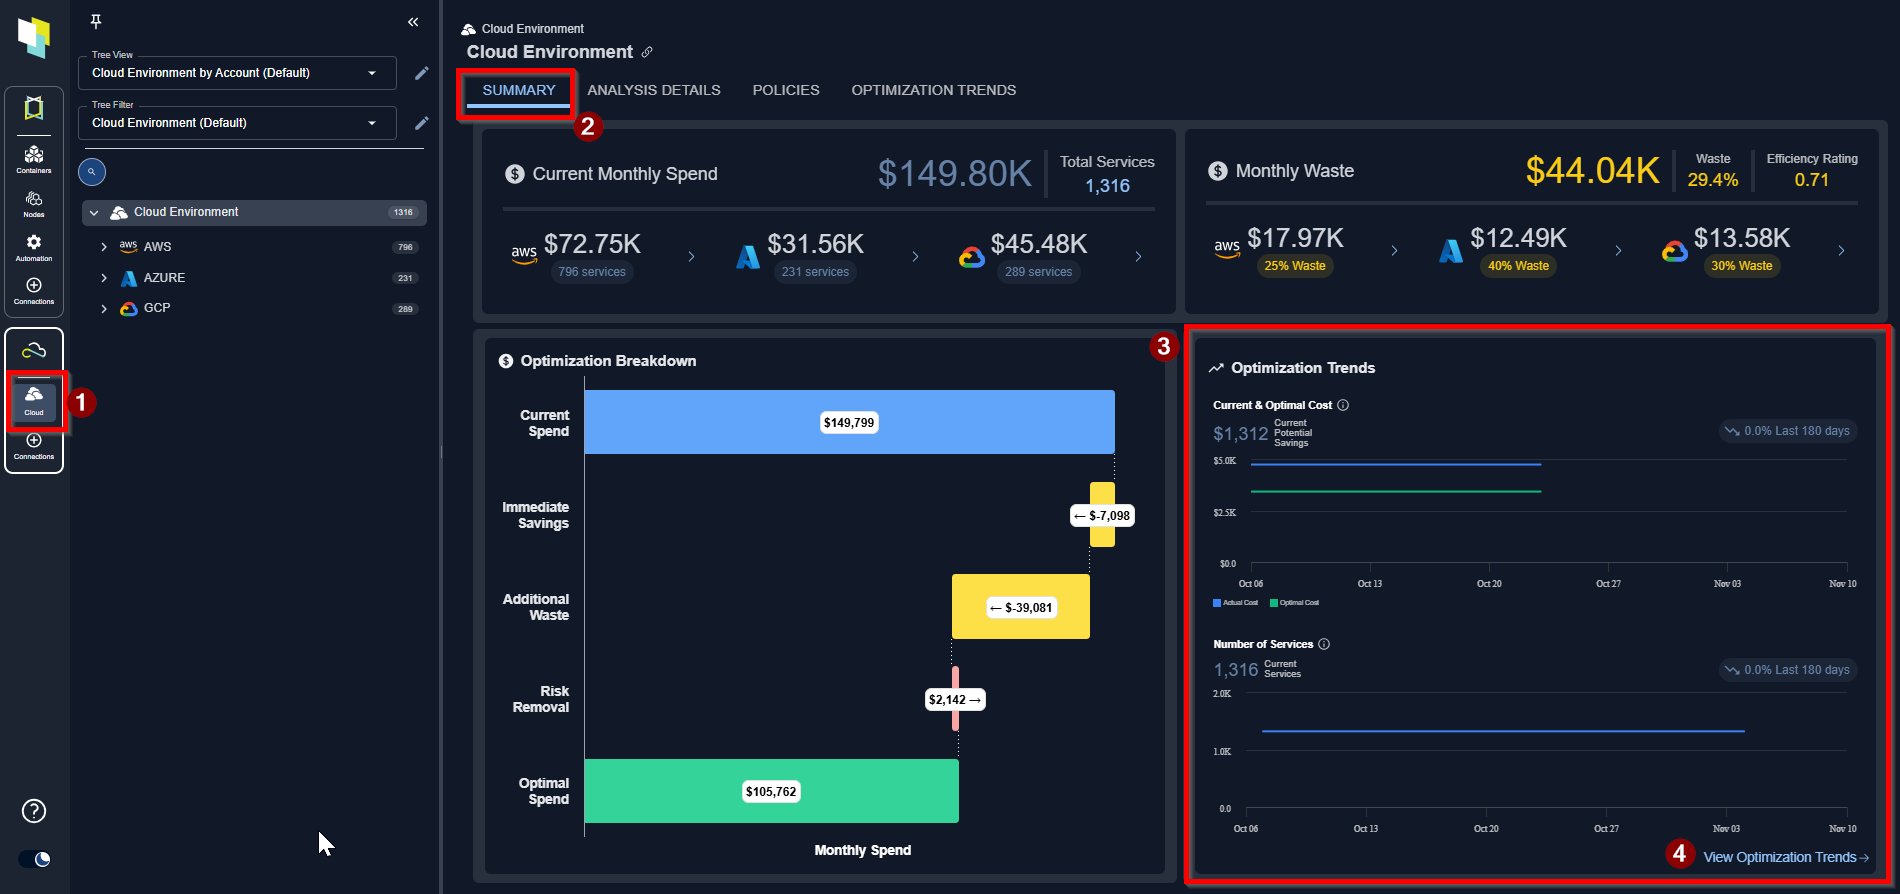
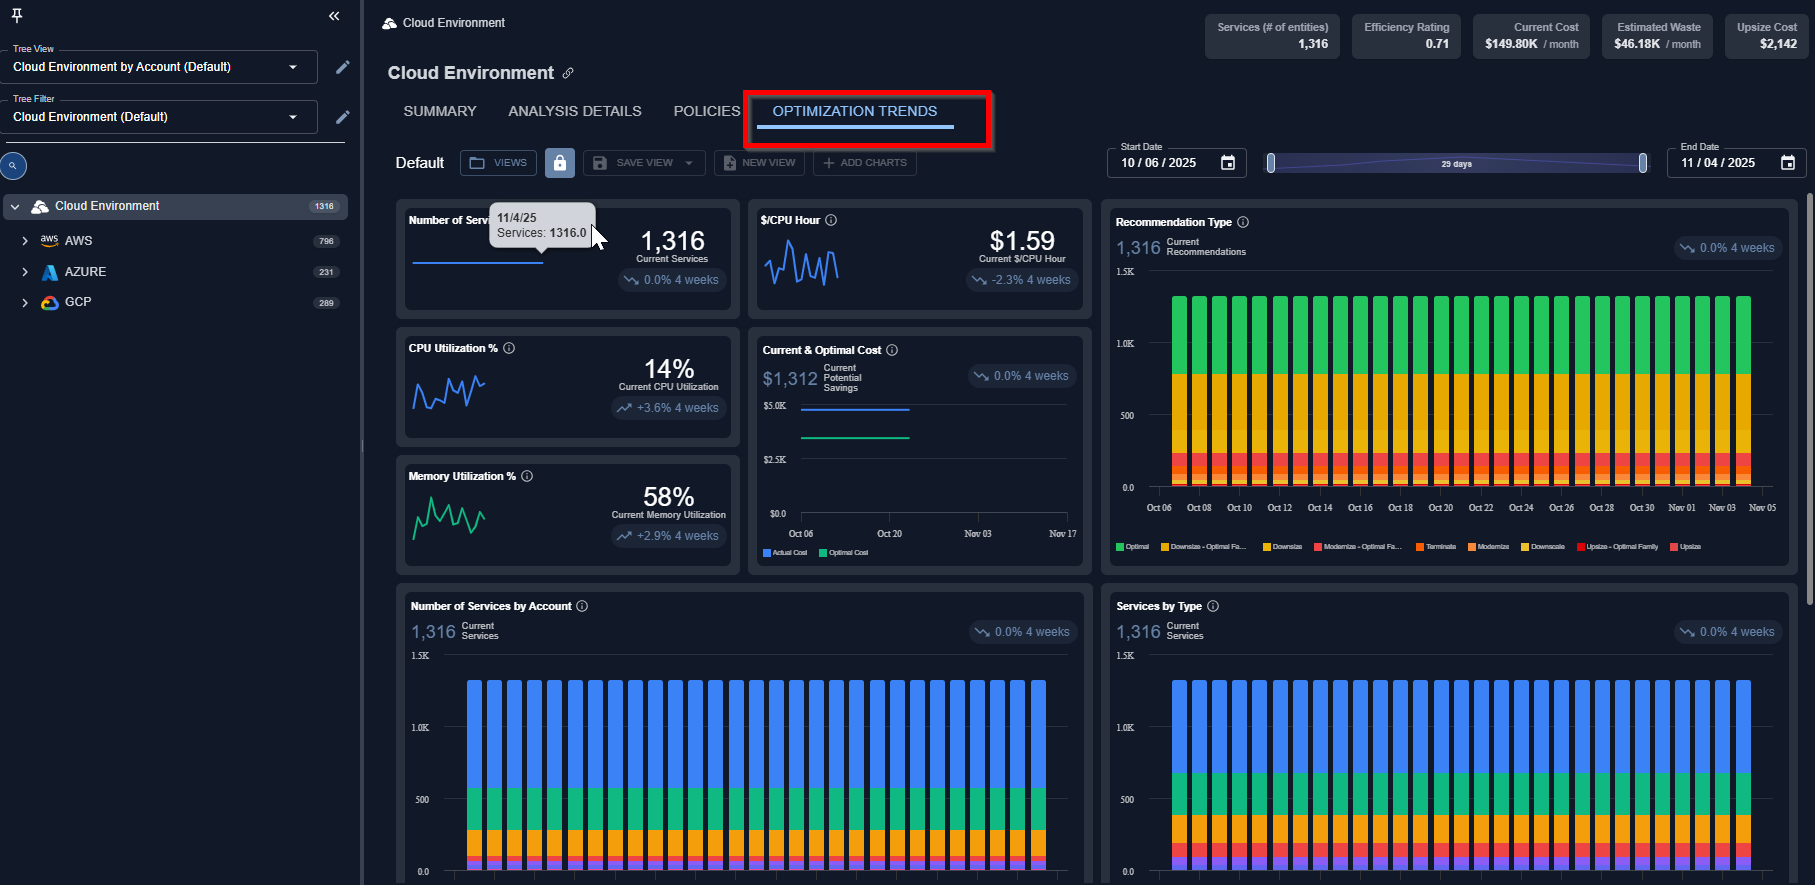
Optimization Trends
- The Optimization Trends reports visualize historical trends across key operational metrics, including instance counts, costs, savings, and CPU/Memory utilization. This helps users better understand performance patterns and optimization impact over time.
- Dashboards can be personalized — users can select which reports to display and organize them in their preferred layout. Each report can be resized to small, medium, or large for optimal viewing.
- Users can save dashboards as public (where others in your organization can view but not edit) and private (where only they can view/edit them).
3.6.0 October 1, 2025
3.6.0 October 1, 2025
Updates to Container Optimization
Updates to Container Optimization
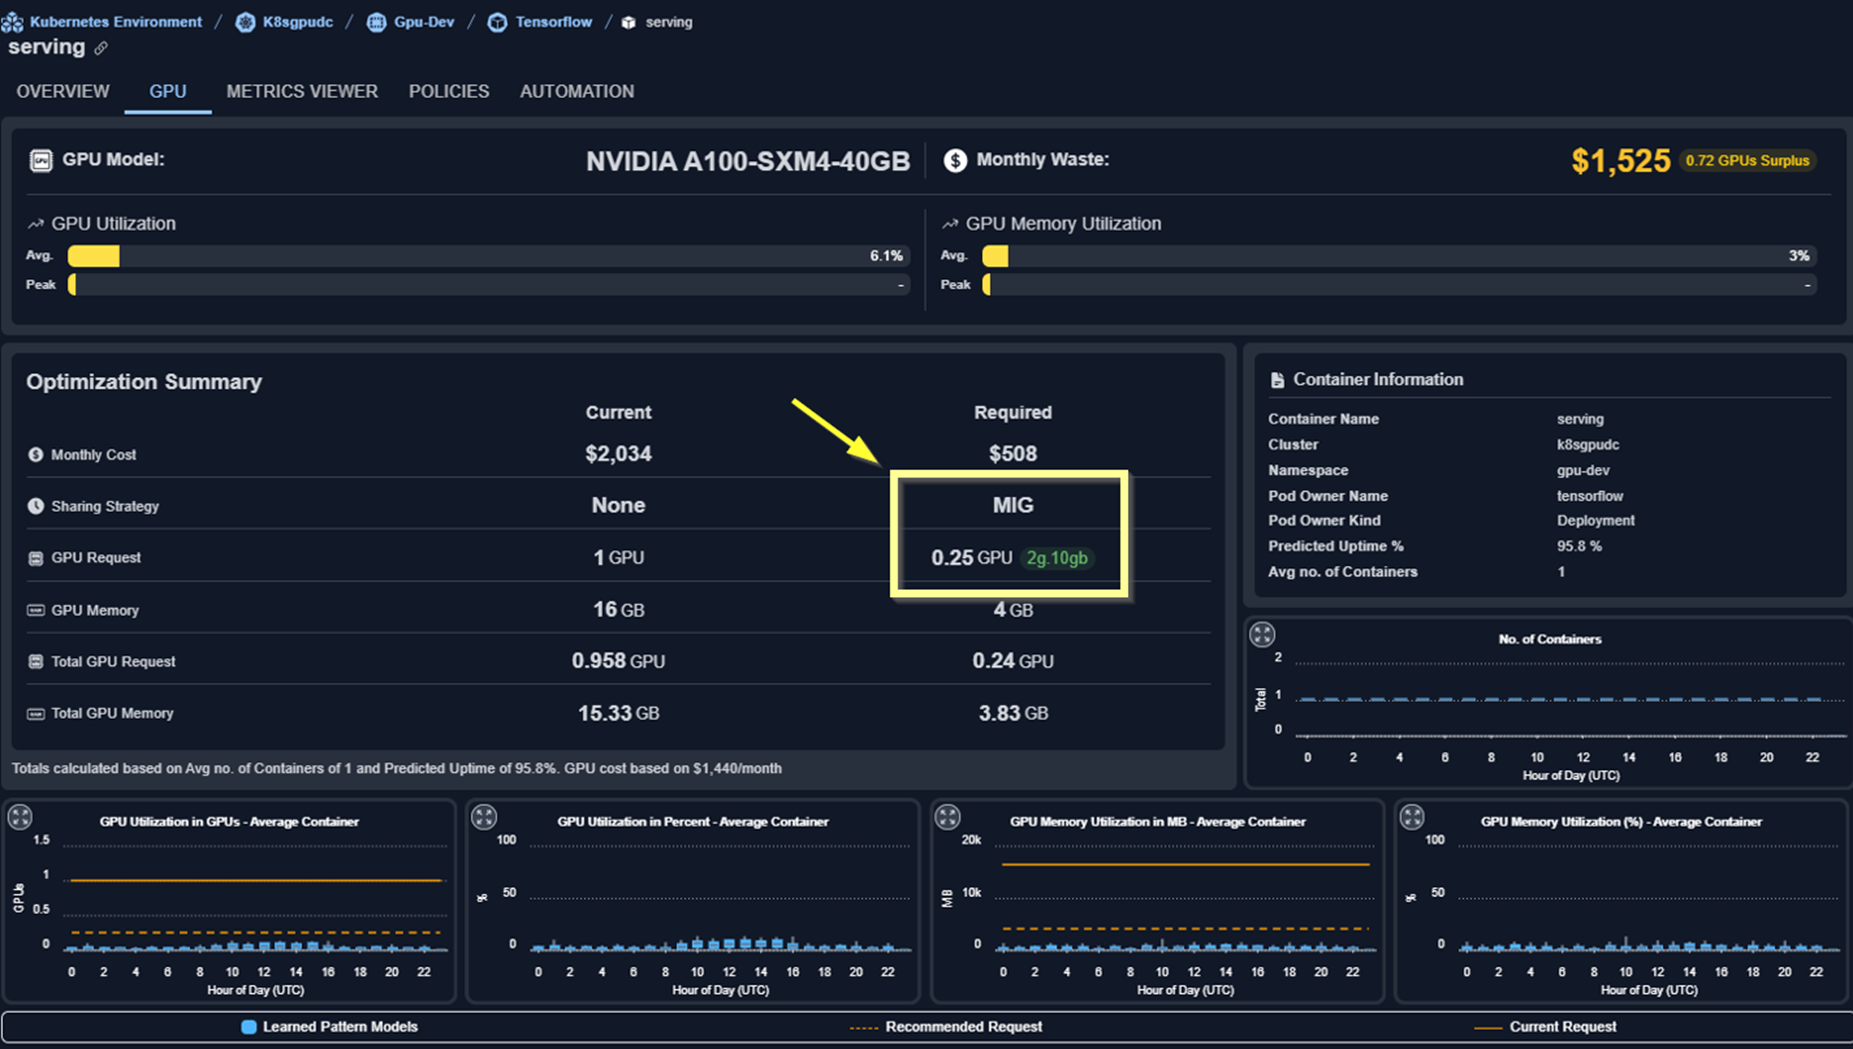
- GPU MIG Recommendation—Supports NVIDIA MIG (Multi-Instance GPU) technology, recommending whether workloads should use a full GPU or a fraction (MIG slice).
- The Analysis Details table will highlight the suggested MIG profile (and the GPU fraction it represents).
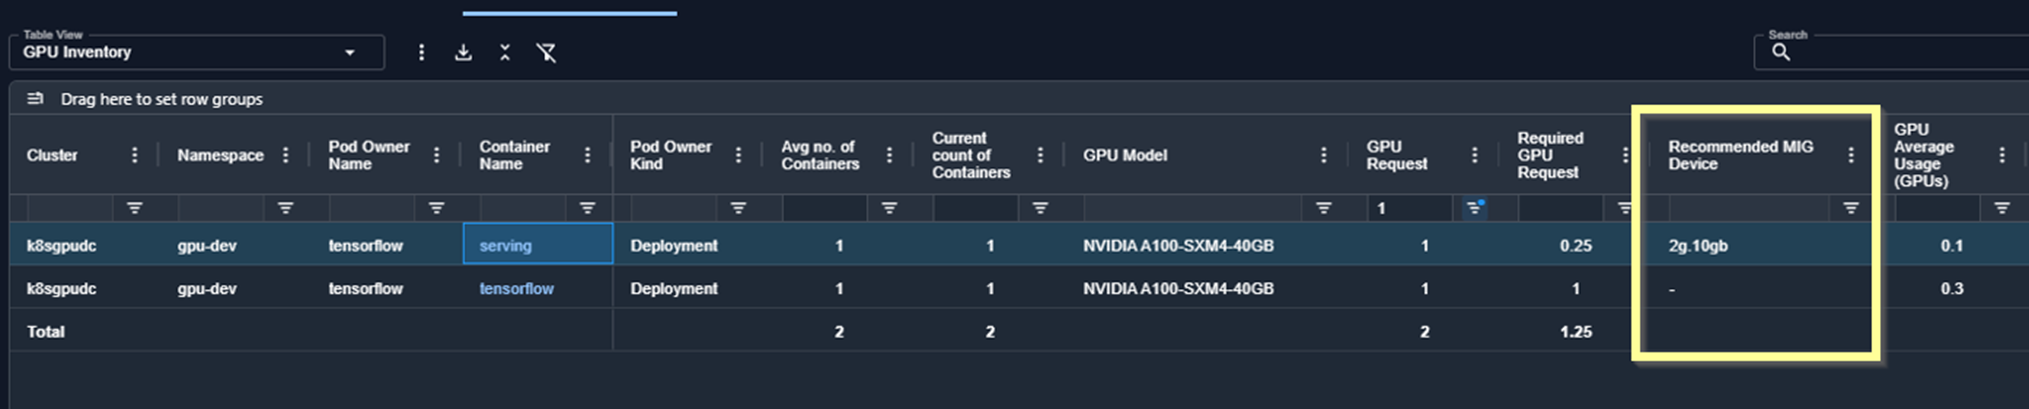
- MIG recommendation info is also available in the GPU tab for an individual container manifest
- Updated Container Summary Tab
- “Waste” links now take you directly to the Analysis Details tab with the appropriate filter preselected
- “Info” tooltip has been added to the Spend Breakdown modal. This highlights the total unspecified CPU/Memory request. With this info, the numbers here and in the Analysis Details table will match up.
- Memory Limit Events (Last Day) added to Analysis Details table—This is a hidden column by default.
- Node/Node Group Analysis—Improved quality of recommendations by switching to “Working Set Memory” when available. Working set memory is a better metric to analyze the memory requirements for Nodes.
- Other Improvements & Updates
- GPU and GPU Memory metrics viewer chart: added “Current Request” line
- Added a new view on the Analysis Details table: “GPU Request Surplus”. This highlights the container manifests that have surplus GPU and can be optimized to reduce waste.
- Container API now include a “analyzedOn” date which allows the automation to only consider fresh recommendations.
- Removed the word “AI” from “AI Analysis Details”
Updates to Cloud Optimization
Updates to Cloud Optimization
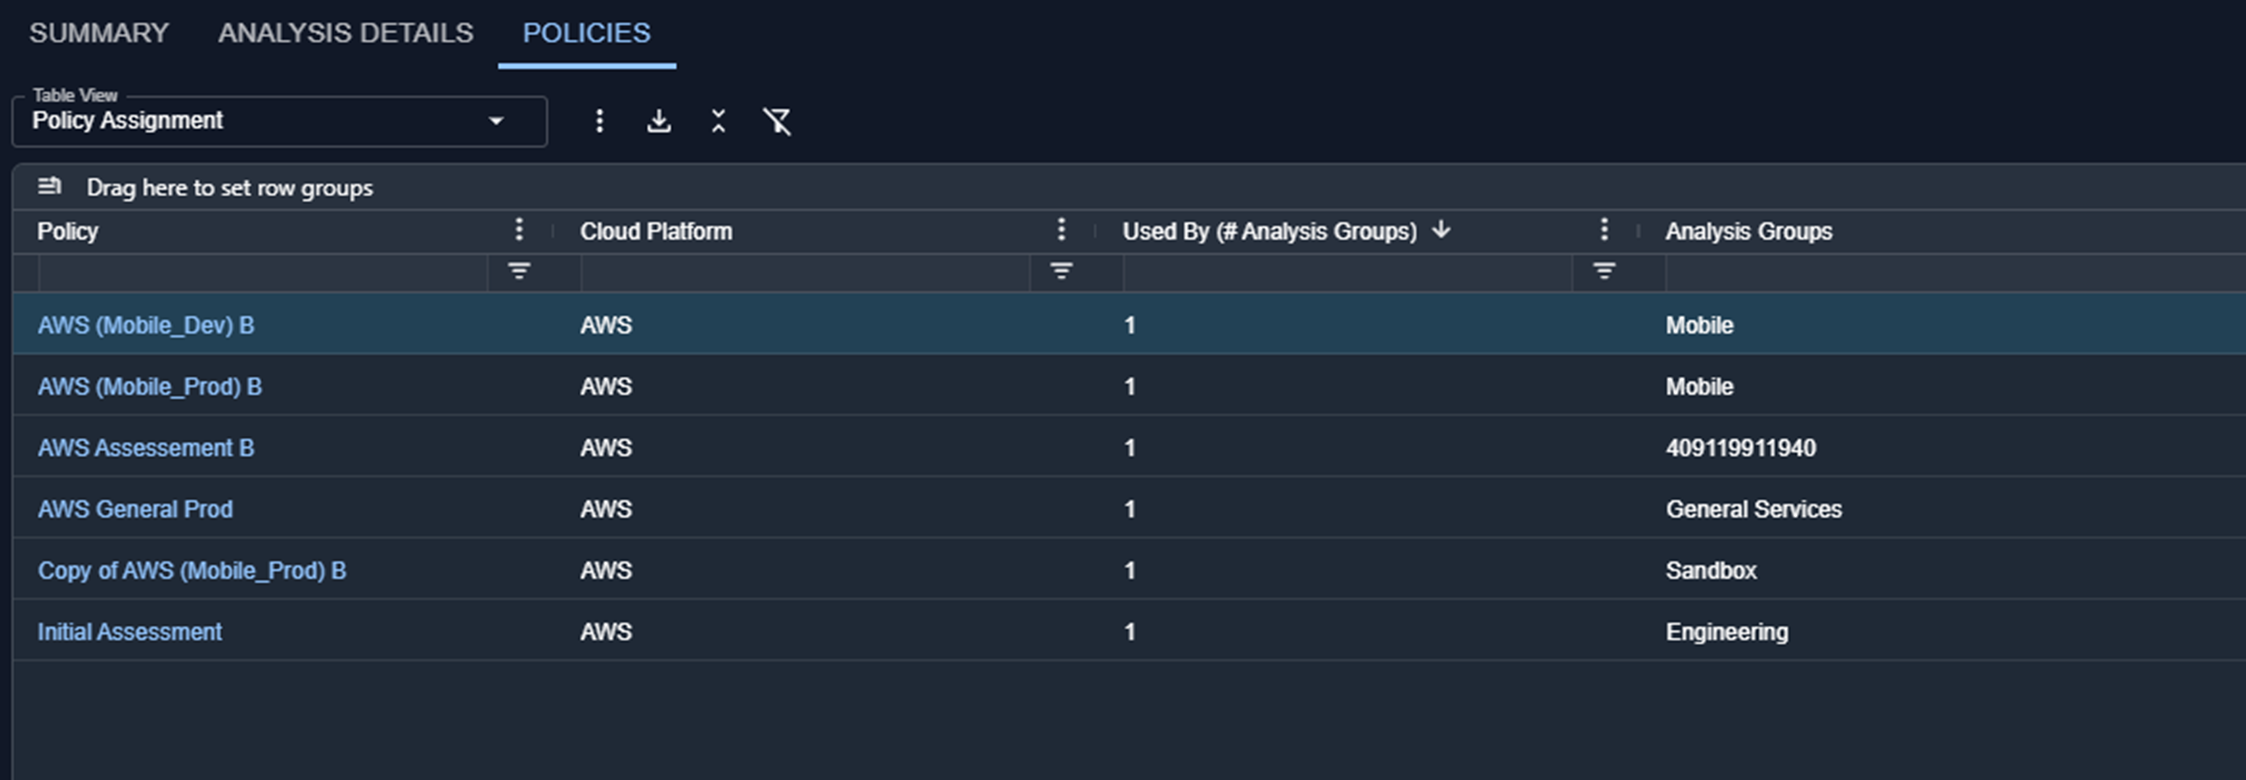
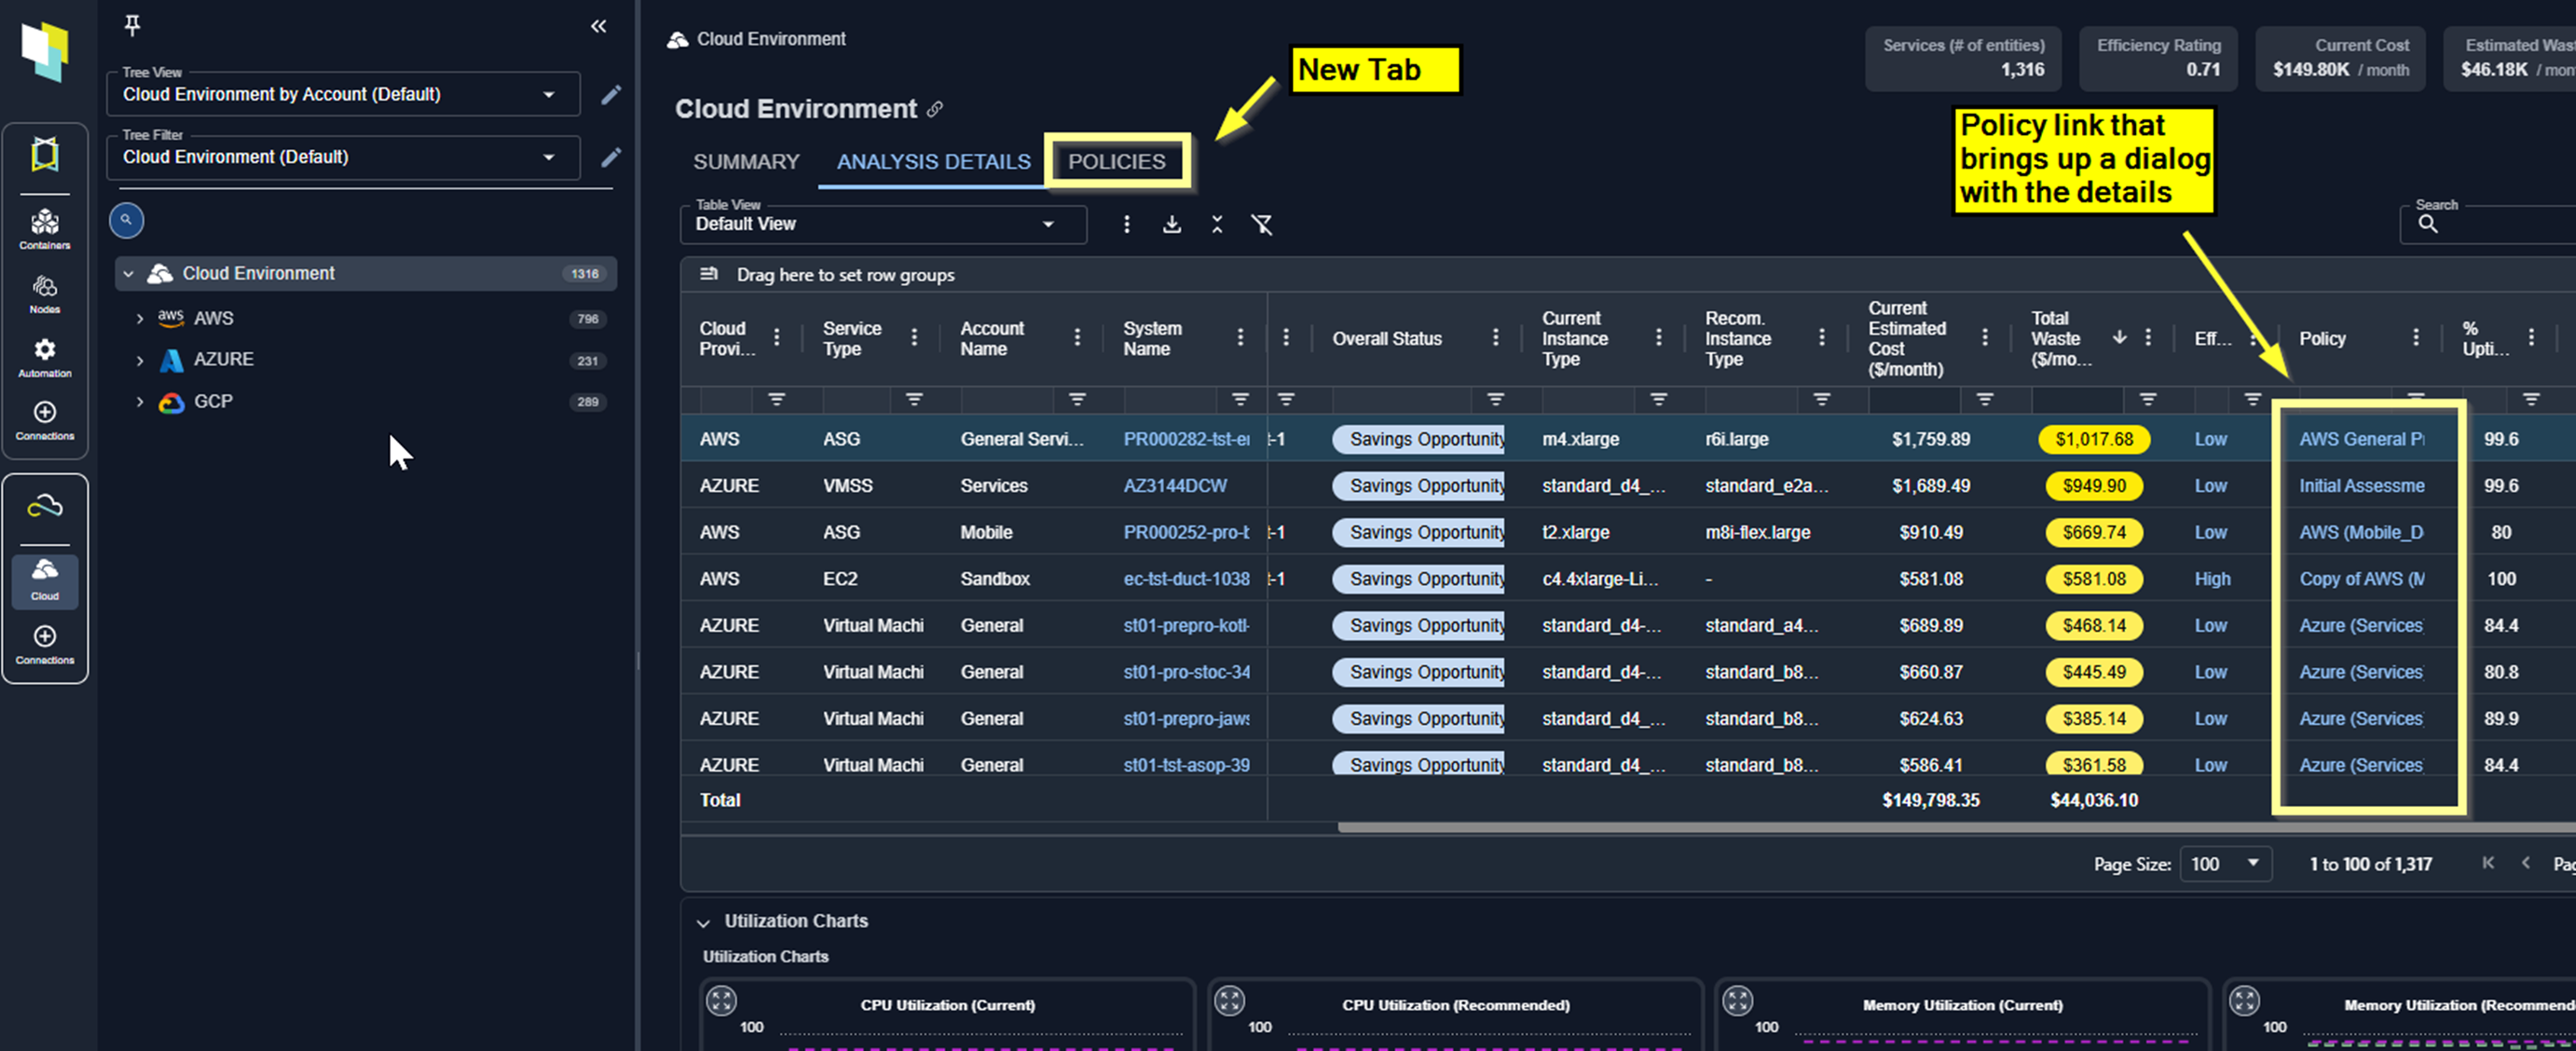
- Policies—View policies for Cloud environments in a new modal, accessible from the Policies tab and Analysis Details table.
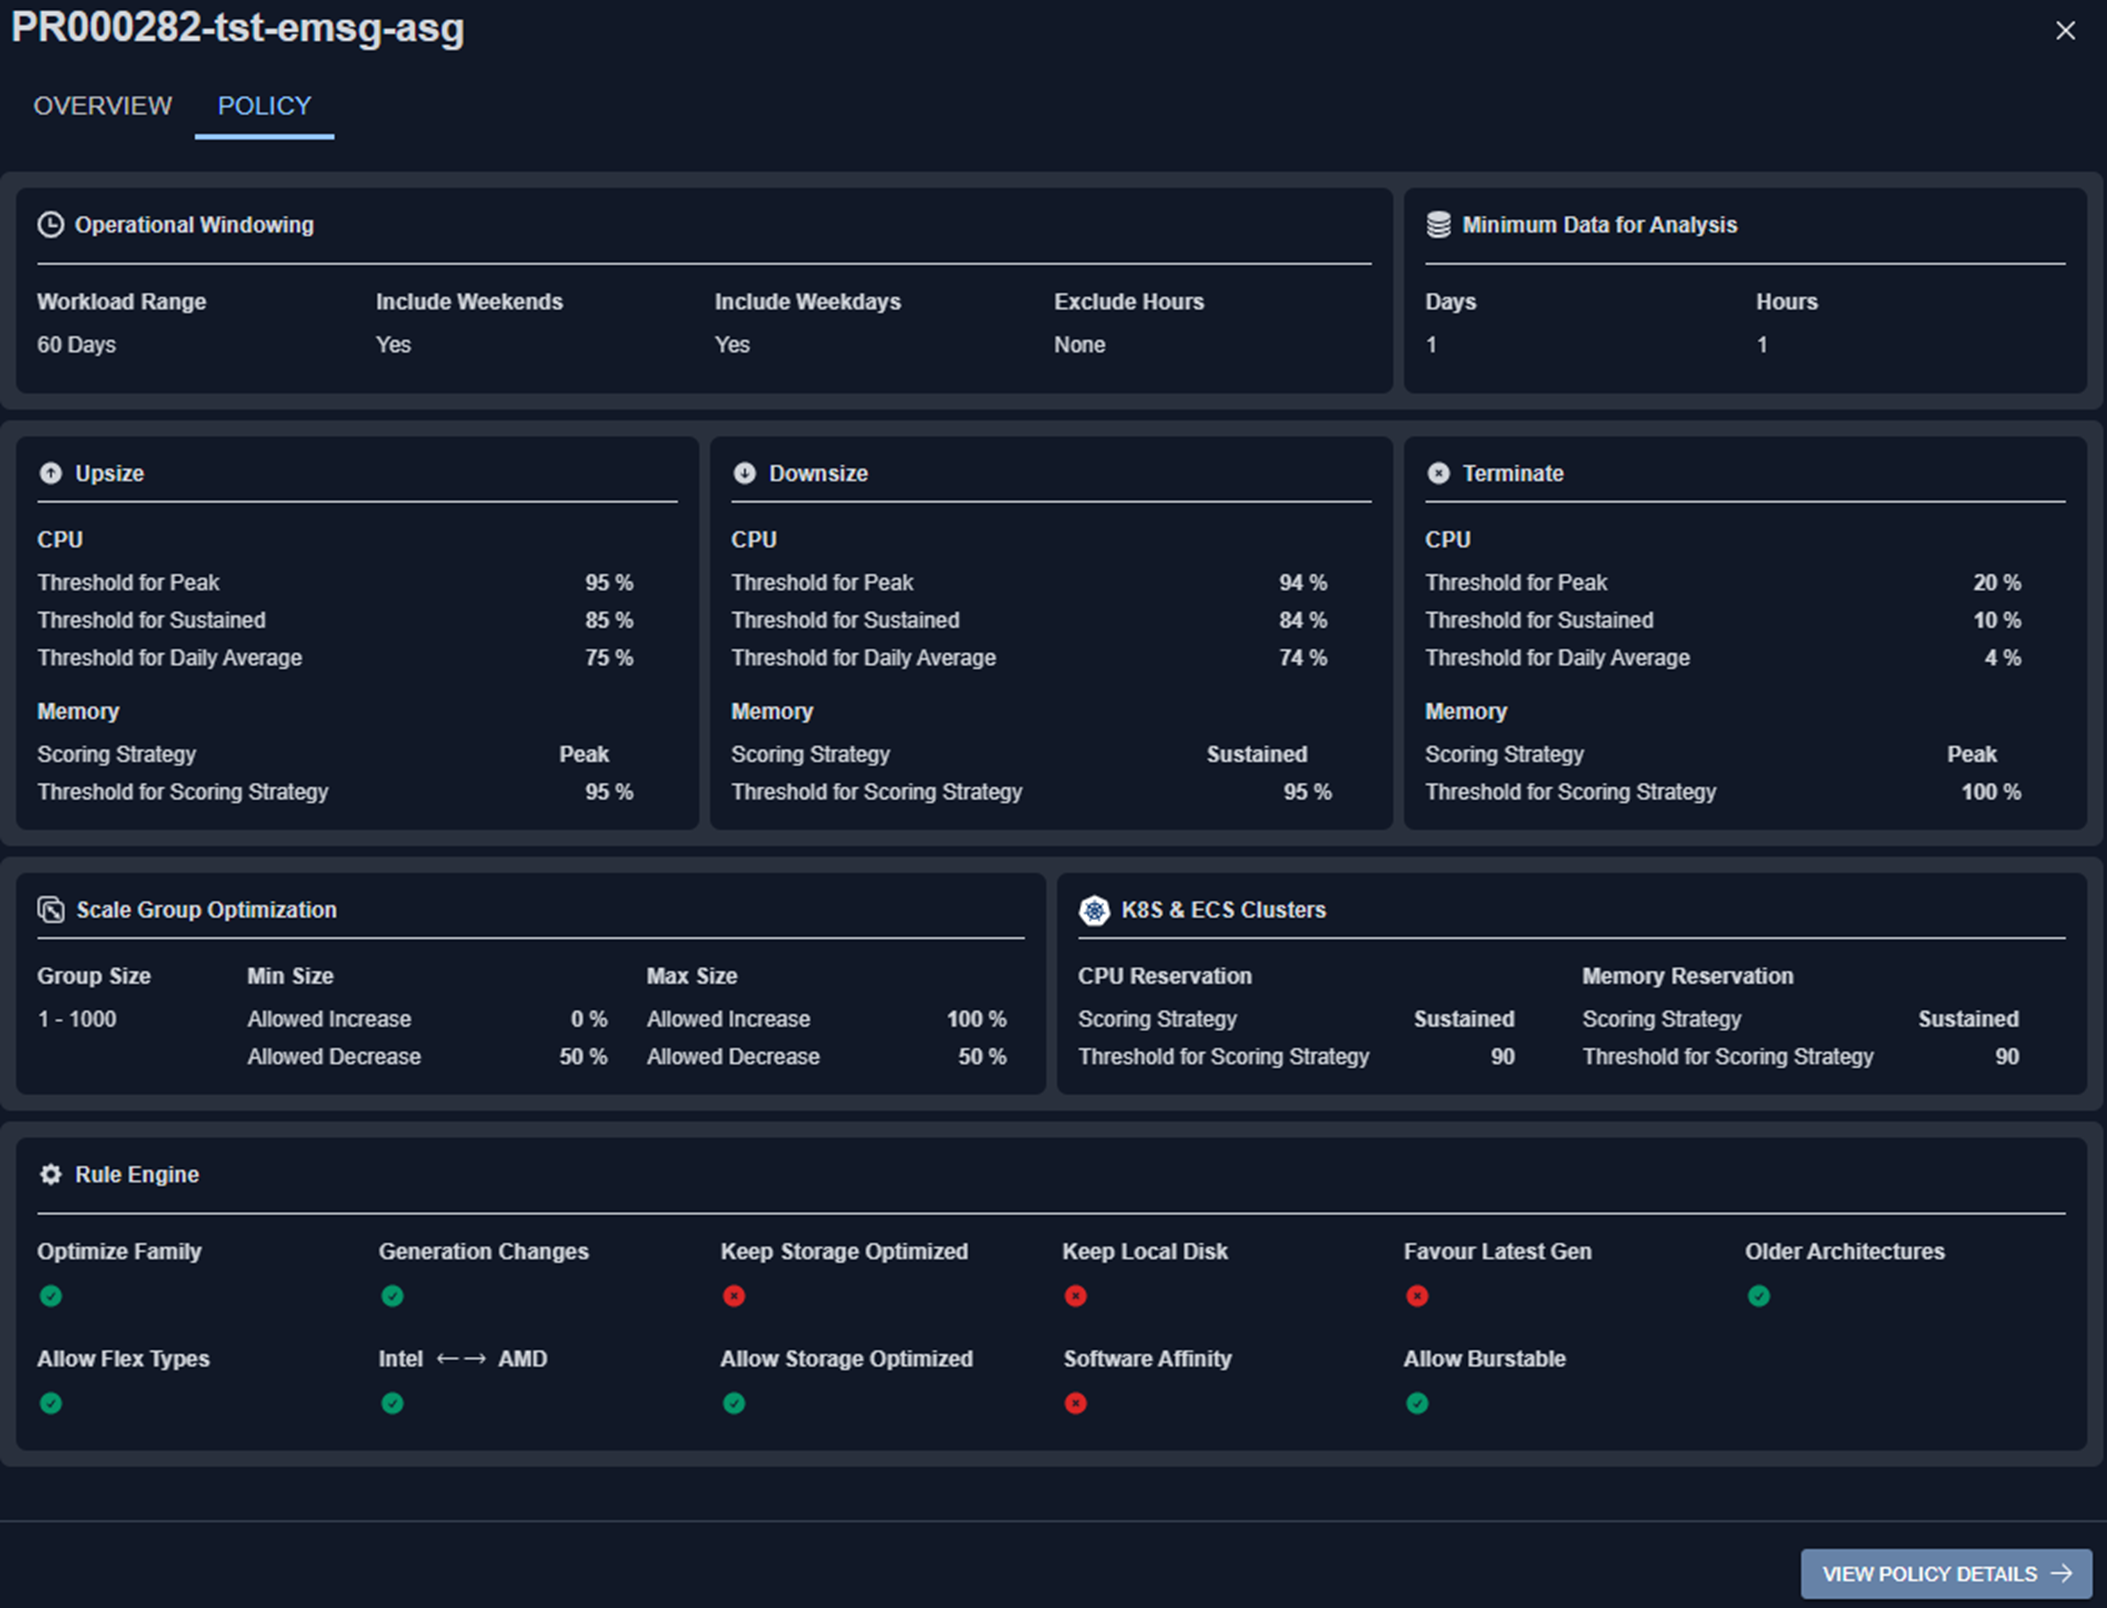
- Policies Tab
- Analysis Details Table
- Updated Azure Catalog Map—Azure Catalog Map has been updated to show all supported VM types and sizes. These are displayed on the map when “Commonly Used” is unselected.
- Added columns to Analysis Details table
- Comment
- Recommendation Reason
- RDS Cluster ID
- Resource Tags
Administration
Administration
- SSO with Okta—Removed requirement for Okta’s CAS (Central Authentication Service).
- Password Reset—Password reset emails now link to Kubex instead of Kubex Console.
3.5.0 August 13, 2025
3.5.0 August 13, 2025
Updates to Container Optimization
Updates to Container Optimization
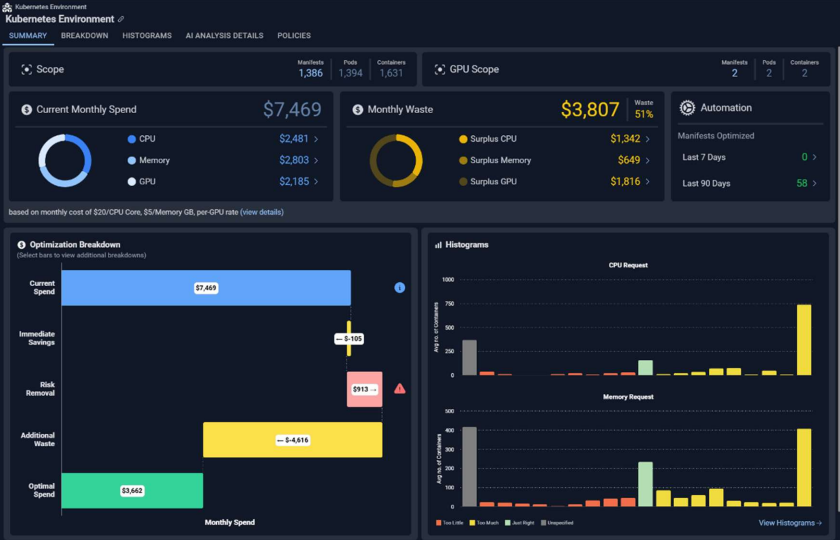
- Updated Container Summary Tab—The container summary page has been updated with a new look and feel to better highlight current spend, waste, and risk.
- Container Out of Memory Kills—Container out of memory kill data is now visible in OOM Kills (Last Day) column on the Analysis Details page:
- Badges will display on summary and histogram page to indicate if there are OOM Kills in the environment
- ML Model and historical data available in the Utilization Charts carousel and Metrics Viewer
- CPU Throttling (%)—CPU Throttling data is now visible in CPU Throttling (%) column on the Analysis Details page:
- ML Model and historical data available in Utilization Charts carousel and Metrics Viewer
- Automation Tab—Automation tab has been added to highlight request and limit changes made by the Kubex Automation Engine. An overview of optimized manifests is also available on the summary page
- Business & Operational Attributes—Various business and operations related attributes (e.g., Application, Business Unit, Cost Center, Operational Environment) have been added to the tree view/filter options and Analysis Details columns
- GPU Optimization for Container Resource Requests—– Containers with GPUs
allocated now receive recommendations for downsize opportunities. The GPU Overview page has been updated to highlight this information:
- Added system views to Analysis Details (Immediate GPU Savings & Addtional GPU Waste)
Updates to Cloud Optimization
Updates to Cloud Optimization
- Effort Popup—The Effort column on the Analysis Details page is now clickable, showing a popup with additional details on the effort required to change to the recommended instance type.
- Overall effort is the highest effort of the individual rule items. Possible values are None, Low, Medium, and High
- Business & Operational Attributes—Various business and operations related attributes (e.g., Application, Business Unit, Cost Center, Operational Environment) have been added to the tree view/filter options and the Analysis Details page. columns
3.4.0 July 9, 2025
3.4.0 July 9, 2025
Updates to Container Optimization
Updates to Container Optimization
- Updated Container Summary Tab—The container summary page has been updated to better highlight both your current spend and the details of possible savings.
- Updated Node Metrics—The Node Metrics Viewer has been updated to show the following GPU metrics:
- GPU Utilization %
- GPU Memory Utilization (%)
- GPU Power Usage (Watts)
- Updated Utilization Chart—The node chart showing the number of pods running on a node has been updated to show the limit for the selected node.
- Customizable Data Aggregation—You now have the ability to edit how grouped data in a table is aggregated (i.e. sum, average, max, etc.) and save your customization in a table view. This feature is available for containers, node groups, nodes and cloud instances.
Updates to Cloud Optimization
Updates to Cloud Optimization
- Cloud Connections—In this release you can now can create and edit the connections to AWS and Azure. You can also view data collection status for each of the connections. Kubex uses these connections to collect data from each account, daily.
- Accessing the Catalog Map—You can now access the catalog map directly from the Analysis Details tab. The catalog map with a modal view has been added to the utilization charts. You now do not need to leave the Analysis Details tab to use the catalog map.
- Summary Tab—The Cloud Summary tab has been updated to improve useability.
Enhanced Cost Modeling
Enhanced Cost Modeling
- Azure Hybrid Benefit Status—As part of enhancing the cost data model, Kubex needs to distinguish between systems that are BYOL (also called Azure Hybrid Benefit or AHB) to accurately represent the cost of the system. The license model is available in the existing data collection configuration so no changes are required to the minimum permissions for BYOL VMs.
- Azure Instance OS Name—Kubex now determines the type of Linux OS. In this release RHEL and SUSE are supported. The OS name is used to accurately determine instance costs.
- Updated Cost Model—The cloud cost data model has been updated to apply discounts based on the following details:
- OS Type—The type of Linux OS installed on a cloud instance. This is not an attribute and is stored in a table but cannot be edited or cleared like an attribute.
- License Model (Attr_key is aws:licensemodel)—The licensing model that has been configured for a cloud instance )
- Life Cycle (Attr_key is aws:lifecycle)—This attribute is not currently used but is collected for future development. It is used to store whether or not the instance is a spot instance. Possible values are “spot” or “normal”
3.3.0 June 25, 2025
3.3.0 June 25, 2025
Updates to Container Optimization
Updates to Container Optimization
- Node Modal—A new modal opens when you click a node name on the Node Details page.
- Performance Improvements— The Kubex UI no longer retrieves data from the Kubex Reporting Database (RDB). All UI component queries are directed exclusively to Kubex-specific tables in MS SQL.
3.2.0 June 11, 2025
3.2.0 June 11, 2025
Updates to Container Optimization
Updates to Container Optimization
-
GPU Metrics for Containers—In this release Kubex introduces reporting of GPU configuration and utilization data for containers, node groups and nodes. This data enables you to identify GPU-enabled containers and nodes in your environment and see how effectively you are utilizing your GPU resources.
You must have data forwarder v4.2.1 deployed to collect the GPU data from your environments.
There are updates on many pages to highlight GPU resource configuration and utilization:
-
Updated Analysis Details—A number of data points allow you to identify containers with GPU requests and to determine where the GPU and GPU memory request values are higher than peak utilization over a given period.
The analysis populates these attribute values based on the date range and data selection options that are defined in your container optimization policy. The Analysis Details page has been updated to display the following GPU data.
- GPU Model
- GPU Request
- Total GPU Request
- GPU Average
- %GPU Average
- GPU Sustained
- GPU Min
- GPU Memory Request
- Total GPU Memory Request
- GPU Memory Average
- % GPU Memory Average
- GPU Memory Sustained
- GPU Memory Min
- GPU Power Usage Peak
- GPU Power Usage Average
-
New Views—Four new views have been added to the Analysis Details page. These views allow you to focus on your GPU data:
The default view has been updated to include GPU data.- GPU Inventory
- GPU Cost
- GPU Low Utilization
- GPU Memory Low Utilization
- Updated Summary—New GPU-specific cards have been added to the containers Summary page. A note includes a link that opens a modal containing GPU pricing details. The top two cards on the Summary page have also been updated to better highlight both your current spend and the details of possible savings.
- New GPU Tab—A new GPU tab has been added when reviewing a single container. This new page provides details of the GPU utilization on the selected container.
-
Updated Metrics Viewer—The following GPU metrics are available in the metrics viewer:
- GPU Utilization in GPUs - Average Container
- GPU Memory Utilization (MB) - Average Container
- GPU Memory Utilization (%) - Average Container
- GPU Power Usage (Watts) - Average Container
-
Updated Analysis Details—A number of data points allow you to identify containers with GPU requests and to determine where the GPU and GPU memory request values are higher than peak utilization over a given period.
The analysis populates these attribute values based on the date range and data selection options that are defined in your container optimization policy. The Analysis Details page has been updated to display the following GPU data.
-
GPU Metrics for Node Groups—GPU metrics have also been added for Node Groups and individual nodes.
- Allocatable GPU Memory (GB)
- Allocatable GPUs
- Allocatable Memory (GB)
- Average CPU Utilization (%)
- Average GPU Memory Utilization (%)
- Average GPU Utilization (%)
- Average Memory Utilization (%)
- GPU - Node Balance Ratio
- GPU Capacity
- GPU Memory - Node Balance Ratio
- GPU Memory Capacity (GB)
- GPU Request (% of Allocatable)
- No. of Nodes with Underused GPU
- No. of Nodes with Underused GPU Memory
- Nodes with Underused GPU Memory(%)
- Nodes with Underused GPU(%)
- Peak GPU Memory Utilization (%)
- Peak GPU Utilization (%)
- Primary Node GPU Model
- Primary Node Type GPU (GPUs)
- Primary Node Type GPU Memory (GB)
- Unallocated GPUs
- Updated Node Overview Tab—This tab has been updated add GPU details and to improve usability.
-
New Data in Analysis Details—Six new data points allow you to find containers where the CPU and memory request values are higher than peak utilization over a given period.
The analysis populates these values based on the date range and data selection options that are defined in your container optimization policy.
- CPU Peak—Highest peak value in mCores, on the busiest container.
- CPU Sustained—Highest sustained value in mCores, on the average container.
- CPU Min—Lowest value in mCores, on the average container.
- Memory Peak—Highest peak value in MB, on the busiest container.
- Memory Sustained—Highest sustained value in MB, on the average container.
- Memory Min—Lowest value in mCores, on the average container.
- Timezone—The utilization charts for containers, node groups and nodes have been updated to standardize the timeline on UTC. The X-axis label has been updated to indicate the timezone designation for all charts to ‘UTC ’.
- Updated Node Overview—The node overview page has been updated to improve useability and add details of GPU utilization.
Updates to Cloud Optimization
Updates to Cloud Optimization
- Timezone—The X-axis label has been updated to indicate the timezone designation for all historical utilization charts to ‘UTC ’ This change to does not currently apply to the ML charts. The ML charts on the Analysis Details page use Kubex server’s time. So this will be either “Eastern Time” or “Central Europe Time”.
3.1.0 May 14, 2025
3.1.0 May 14, 2025
- Users no longer need to clear their browser cache after an upgrade. When using the Kubex Console users must clear their browser cache after an upgrade,
- Analysis Details Export —When the content of the Analysis Details is exported, the Container Name is provided as a hyperlink that takes you to the Overview page for the selected container. When you open the exported .XLS file, the content initially appears as plain text, and when you click on the cell it becomes a hyperlink.
- Node Group Overview—The cards on the Node Group Overview page have been updated to better report on the status of a single node group. Additionally, utilization charts have been added to this page so you can review detailed metrics for a selected node group.
- New Filter—A new public filter, “With automation enabled”, has been added to the container tree viewer. When selected this filter displays all containers with automation enabled. i.e. Automation Enabled = true.
- Improved Performance>—By focusing on nodes that were running in the last day rather than the past 7 days you will notice improved performance when working with nodes and node groups.
- Access to the Online Help—A new help icon provides direct access to the online help.
- Renamed Value—The value, “No. of Containers” has been renamed to, “Avg No. of Containers”. The new name more appropriately describes the value. The following pages have been updated: Summary, Overview, Histogram and Analysis Details.
3.0.0 April 23, 2025
3.0.0 April 23, 2025
New Public Cloud Management Console
New Public Cloud Management Console

In this release Kubex introduces Public Cloud optimization features. In this new console, Kubex’s patented analytics determine optimal resource settings for your public cloud environments and display the results in a new user interface.
Use the new console to review resource utilization across your AWS, Azure and Google Cloud environments.
Kubex Updates
Kubex Updates
- Automation Tab—A new automation tab has been added to report on the status of the Kubex Container Automation solution.
- Updated Connections Table —The following changes have been made to this table:
- Three new columns have been added: Cluster Version, Kubex Collection Stack Version and Prometheus Version
-
A link that provides secure Kubex credentials has been added. The credentials are provided in a code snippet than can be copied directly into your
values.edit.yamlfile. This new method makes it easier for you to set up container data collection, reducing the previous manual dependency of requesting these credentials from Kubex.
- Updated Optimization Breakdown—Hovering over any bar in this chart, displays a description of the recommended optimization. Badges have also been added to indicate significant information, such a s memory events or unspecified resource settings.
- Summary Page—The Summary page has been updated for improved readability.
- Cost Modeling—Kubex now has improved algorithms that use existing utilization data to estimate the cost for containers with unspecified CPU/memory request values. The Summary, Analysis Details, and Overview pages have all been updated to show the cost estimates for these containers. The following updates have been made to show these values:
- Two columns have been added to the Analysis Details tab:
- “Total Surplus CPU Request from Unspecified (mCores)”;
- “Total Surplus Memory Request from Unspecified (MB)”
- Two system views have been added to the Analysis Details tab:
- “CPU Request Shortfall (from Unspecified)”
- “Memory Request Shortfall (from Unspecified)”
- The Overview tab and single instance modal page have been updated to add details of unspecified CPU and memory request settings. These additional cards are only displayed if the selected container does not have specified CPU and/or memory request settings.
- Two columns have been added to the Analysis Details tab:
Kubex Automation
Kubex Automation
New Kubernetes API Endpoints
New Kubernetes API Endpoints
GET /kubernetes/clustersGET /kubernetes/clusters/<clusterName>GET /kubernetes/clusters/<clusterName>/containersGET /kubernetes/clusters/<clusterName>/containers?details=trueGET /kubernetes/clusters/<clusterName>/automation
- Kubex Automation—Indicates whether the container is eligible for automation within Kubex.The attribute is set one-time, is static, and is not inherited from cluster, node group, or any higher level.
- Kubex Policy—Indicates what policy to use when automation is enabled.
Updated API Token Expiry Duration
Updated API Token Expiry Duration
Changes to Scale Groups with Max Size =1
Changes to Scale Groups with Max Size =1
- Kubex Console:
- Singleton ASGs/VM Scale Sets will now only appear in the corresponding ASG or VM Scale Set tabs.
- If you have large number of these singleton scale groups, you may notice a decrease in the number of EC2 and Azure VMs reported, while the ASG and VM Scale Set counts will increase accordingly.
- The Catalog Map will no longer report on ASGs and VM Scale Sets with Max Size =1.
- No change to the Impact Analysis and Recommendation Report for ASGs, as this report recognized singleton ASG instances and reported on them accordingly.
- Scaling Recommendations:
- Singleton scale groups will now have scaling recommendations, as required. Previously, there were no scaling recommendations, only instance type change recommendations.
- If you need to control the group size and prevent scaling, use the “Group Max Size Override” and “Group Min Size Override” attributes. See Overriding Cloud Recommendations. Contact support@kubex.ai for detail of configuring these attributes.
- API Results:
- There are no changes to how scale groups are managed through the Kubex API. Scale groups have service type “ASG” or “VMSS”.
- Scaling recommendation are already included in the results. See Analysis: AWS Recommendations. or Analysis: Azure Recommendations..
- Licensing:
- Currently, singleton scale groups are licensed as individual EC2/VMs.
- With this update, ASG licensing can be based on 1 ASG = 4 licenses OR 1 license per instance, based on the average number of instances in the scale group. VM Scale Sets are licensed using 1 license per instance, based on the average number of instances in the group. See License Compliance Report.
- The current container licensing model is based on the last known number of containers, on which the scale groups are running. With this change, container licensing will be calculated based on the average number of containers used, over the data range, as defined in the policy.
Updated Public Cloud Catalog
Updated Public Cloud Catalog
- AWS Metadata Updates:
- The pricing has been updated and is correct as of April 7, 2025.
-
The following new instance type has been added:
- i8g.48xlarge
- Azure Metadata Updates:
- The pricing has been updated and is correct as of April 7, 2025.
-
The following new instance families have been added:
- Dsv6
- Ddsv6
- Dasv6
- Dadsv6
- Dlsv6
- Dldsv6
- Dalsv6
- Daldsv6
- Esv6
- Edsv6
- Easv6
- Eadsv6
- Fasv6
- Falsv6
- Famsv6
-
Retired the following instances:
- NC
- NC-Promo instances
- NCv2 instances
- GCP Metadata Updates:
- The pricing has been updated and is correct as of April 14, 2025.
-
The following new instance families have been added:
- c4a-standard-lssd
- c4a-highmem-lssd
Container Data Forwarder
This section lists new features and updates to the Container Data Forwarder. A Helm chart bundles all of the components required for container data collection and automates the process. See Kubex Collection Stack for details for a single-cluster configuration. Refer to Github repository for samples and configuration files for multi-cluster configurations. When deploying the Container Data Forwarder ensure that the same version is deployed for all of your clusters. See Data Collection for Containers4.4.0 - March 23, 2026
4.4.0 - March 23, 2026
Ephemeral Storage metrics
Ephemeral Storage metrics
- Enables support for ephemeral storage analysis and recommendations
Node Group Detection
Node Group Detection
- Kubernetes labels
- OpenShift machine sets
- Node roles
4.3.0 - November 28, 2025
4.3.0 - November 28, 2025
Google Managed Prometheus (GMP) Support
Google Managed Prometheus (GMP) Support
- GKE Autopilot Compatibility—GMP is now fully supported, enabling data collection from GKE Autopilot clusters where traditional Prometheus deployments are not possible.
- Managed Service Integration—Leverages Google’s managed Prometheus service for seamless data collection without requiring in-cluster Prometheus installations.
Enhanced Job Configuration
Enhanced Job Configuration
- backoffLimit Support—The data forwarder now supports configuring
backoffLimitfor both Job and CronJob resources, providing better control over retry behavior when data collection encounters transient failures.
4.2.2 - June 16, 2025
4.2.2 - June 16, 2025
Added GPU Metrics
Added GPU Metrics
-
The following GPU metrics are now collected for Containers:
- GPU Utilization in GPUs - Average Container*
- GPU Utilization in Percent - Average Container*
- GPU Memory Utilization in MB - Average Container*
- GPU Memory Utilization (%) - Average Container*
- GPU Power Usage (W) - Average Container*
- GPU Utilization in GPUs - Busiest Container
- GPU Utilization in Percent - Busiest Container
- GPU Memory Utilization in MB - Busiest Container
- GPU Memory Utilization (%) - Busiest Container
- GPU Power Usage (W) - Busiest Container
-
The following GPU metrics are now collected for nodes:
Only those metrics indicated with an asterisk(*) are displayed in the current Kubex user interface. The remaining metrics will be covered in a future release.- GPU Utilization( GPUs)
- GPU Utilization(%)*
- GPU Memory Utilization (MB)
- GPU Memory Utilization (%)*
- GPU Power Usage (W)*
- GPU Requests (GPU)
- GPU Limit (GPU)
Updated Helm Charts
Updated Helm Charts
- All-In-One Kubex Collection Stack has been updated to version 0.9.8;
- The chart containing only the data forwarder has been updated to version 4.0.6.
- The metrics that are retained in Prometheus are now limited to only the metrics that Kubex requested. This change reduces the resources consumed by Prometheus, in large clusters.
- Both the pod security context and container security context are now set for all of the AIO chart components, including the Kubex data forwarder, Prometheus, Node exporter etc. This includes using the runtime default seccomp profile, running as a non-root user, no privileges for escalation, mounting the root file system as read-only, etc.
- A sizing option for Prometheus resources, has been added. The size is based on the cluster size.
- The Prometheus subchart has been updated to the latest version.
- The Prometheus scrape configuration has been updated to use the k8s endpointslice. The endpoints that the data forwarder was using were deprecated in the K8s v1.33 API and will be removed in a future release. Endpointslice has been available since K8s v1.21.
- Installation instructions for offline (or air-gapped) mode are now provided.
upgrade command.4.2.1 - May 29, 2025
4.2.1 - May 29, 2025
4.2.0 - May 15, 2025
4.2.0 - May 15, 2025
Collection of NVIDIA GPU Metrics
Collection of NVIDIA GPU Metrics
- NVIDIA-device-plugin—This plugin allows containers to access the NVIDIA GPUs. It must be installed on all your Kubernetes clusters to allocate NVIDIA GPU resources to workloads and to provide the GPU data.
- dcgm-exporter—This Prometheus exporter exposes GPU metrics from the Data Center GPU Manager (DCGM). It is required to collect GPU data such as, utilization, memory usage, and power usage from NVIDIA GPUs, The dcgm-exporter can be deployed as a DaemonSet, where each node with an NVIDIA GPU runs a pod that exposes these metrics in a format that Prometheus can scrape and the Kubex data forwarder then collects.
- AKS
- EKS
- GKE
HPA Updates
HPA Updates
Updated Kubex Collection Stack
Updated Kubex Collection Stack
- image: densify/container-optimization-data-forwarder:4
- imagePullPolicy: Always
4.1.3 - April 1, 2025
4.1.3 - April 1, 2025
4.1.2 - March 17, 2025
4.1.2 - March 17, 2025
Collection of New Metrics
Collection of New Metrics
- Horizontal Pod Autoscaler (HPA) target metrics—Three new attributes have been added.
- hpa_target_metric_name
- hpa_target_metric_type
- hpa_target_metric_value
- Node taints—The configuration attribute and new metrics will be collected:
- Added the multi-value attribute, “Node Taints” (attr_NodeTaints)
- QoS class—The configuration attribute and new metrics will be collected.
- Added the attribute, Quality of Service Class” (attr_QOSClass)
- Node Working Set Memory Metrics—Working set memory is a process (or container) metric, rather than a node metric. It has been added to align with what is already shown in the AKS console. Kubex provides the following additional node memory metrics:
- working set memory (in bytes)
- working set memory utilization (percent)
- memory utilization (percent) (based on memory_bytes metric)
- memory actual utilization (percent) (based on memory_actual_workload metric)
- total node memory (in bytes) (configuration attribute)
Updated Node Identification
Updated Node Identification
provider_id has been introduced as a third identification component. Currently, nodes are identified using cluster_name and node_name.The provider_id is optional and will be used only if required. In Kubernetes clusters without aprovider_id, node identification will continue to rely on cluster_name and node_name, ensuring that node IDs remain unchanged.Specifically, for EKS and OKE clusters, existing node IDs will change and as a result, node history will be lost since these nodes will receive new IDs.Updated Configuration Setting
Updated Configuration Setting
node_group_list has been updated to add label_karpenter_sh_nodepool. When enabled, Karpenter NodeGroups are discovered and created in Kubex.4.1.1 - November 27, 2024
4.1.1 - November 27, 2024
4.1.0 - September 19, 2024
4.1.0 - September 19, 2024
New Container Metrics
New Container Metrics
- max_cpu_throttling_percent—The Linux kernel allocates “CPU periods” (default = 100 milliseconds) to both processes and containers. The percentage is the number of throttled periods out of the total number of 100-ms periods. This value is a percentage of periods that were throttled vs those that were requested. This provides a more accurate indication of resource limitations. For example if the pod was throttled for 8 seconds out of the 5 minutes, this would be 2.7%, but if the CPU was not actually requested for the full 5 minutes, then the 2.7% is not an accurate representation of the state of the container. If the pod was throttled for 8 seconds, and it’s request was less that than the 300 seconds the throttled percentage is higher.
- avg_cpu_throttling_percent—Indicates the average percentage of the number of 100-ms periods that a container is throttled in terms of CPU usage. The average and maximum values are collected since the container is likely aggregated. Metrics are aggregated at the highest level of the pod owner. For a deployment of one pod in one container the average and maximum will be the same. If it is a deployment of 10 pods then the average and maximum will not be the same.
- sum_cpu_throttling_seconds—Aggregates the total time during which throttling has been applied.
- Container Events—These are not metrics that are collected at 5-minute intervals, but are individual events and the time that the event occurred or was detected. In this version of the data forwarder “process exit” is now collected. The exit code and whether or not this is the main process (i.e. PID #1 using a true/false flag) of the container is collected and stored. In this version process exit will be false only when PID #1 exits with code 137 which corresponds to an OOM kill. In all other cases, process exit will be true.
- CPU Limit—The defined CPU allocation limit for the container.
- Memory Limit—The defined memory allocation limit for the container.
- CPU Request—The defined CPU allocation requested for the container.
- Memory Request—The defined memory allocation requested for the container.
Node-Level Metrics
Node-Level Metrics
- CPU Limit—The defined CPU allocation limit for the node.
- Memory Limit—The defined memory allocation limit for the node.
- CPU Request—The defined CPU allocation requested for the node.
- Memory Request—The defined memory allocation requested for the node.
- Pod Count—The number of pods running on the selected node.
- oom_kill_events—The number of kill events that happened on the node in a 5-minute interval;
- cpu_throttling_events—The number of CPU throttling events that happened on the node in a 5-minute interval;
- cpu_reservation_percent—The percentage of the node’s total CPU resources that are reserved or guaranteed for workloads, containers, or virtual machines.
- memory_reservation_percent—The percentage of the node’s total memory resources that are reserved or guaranteed for workloads, containers, or virtual machines.
- provider_ID—The provider_id is available as a Prometheus label of kube_node_info metric which is extracted to its own column in the k8s_node_v0 postgres table. The relevant node data is then used to facilitate link the Kubernetes node to a cloud instance. This linking will be done in postgres, as will the determination of the relationship between cloud instance and ASGs or VM Scale Sets.
- k8s_version—The Kubernetes version of the node is collected and stored in the attribute, k8s_node. This value is collected for each node and for the cluster. This is currently informational only and is not used not used in the analysis.
Cluster-Level Metrics
Cluster-Level Metrics
Linking Containers to Node Groups
Linking Containers to Node Groups
4.0.0 - May 28, 2024
4.0.0 - May 28, 2024
- image: densify/container-optimization-data-forwarder:4
- imagePullPolicy: Always
Supported Third Party Observability Platforms
Supported Third Party Observability Platforms
- HTTP basic authentication—Supported by Prometheus and is required by some commercial observability platforms, i.e. Grafana Cloud;
- Bearer token—Required by OpenShift Monitoring and some commercial observability platforms, i.e. Azure Monitor;
- AWS SigV4—Required by Amazon Managed Service for Prometheus.
- AWS Managed Prometheus data ingestion requires Prometheus v2.26.0 or higher.
- Starting with version 16.0, the Prometheus chart requires Helm 3.7 or higher, to install successfully.
- Amazon Managed Service for Prometheus (AMP)—Refer to the AWS website for details on AMP. Kubex requires a specially configured role. See Container Data Collection Using Amazon Managed Prometheus for configuration examples.
- Azure Monitor Managed Service for Prometheus (AzMP)—Refer to the Azure website for details. Kubex automates the process of acquiring and get and refreshing security tokens. See Container Data Collection Using Azure Managed Service for Prometheus for a configuration example.
- Grafana Cloud—See Container Data Collection using Basic Authentication for a configuration example.
External Cluster Support
External Cluster Support
Multiple Kubernetes Clusters Support
Multiple Kubernetes Clusters Support
Added Memory Options for Container Data Collection
Added Memory Options for Container Data Collection
Other Features
Other Features
- HTTP retries have been added to the calls to the Prometheus API. This handles observability platform rate limiting.
- The data forwarder now handles the relabel configs of Node Exporter.
- Outdated Node Exporter metrics have been addressed.
- Utilizes improved Horizontal Pod Autoscaler metrics (autoscaling v2).
- The data forwarder has been upgraded to Go 1.22,
- Updated examples for both single and multiple cluster configurations are provided in the new Github repository.
End of Support Notice - Container Data Forwarder 3.x.x
End of Support Notice - Container Data Forwarder 3.x.x
Kubex Automation Engine
1.6.0 - July 06, 2026
1.6.0 - July 06, 2026
Updates and Improvements
Updates and Improvements
- KubeAI
Modelworkload support for automated rightsizing and rollback tracking. - GPU-sharing tuning controls for KAI-based automation strategies.
- Container-level skip controls for rightsizing, so specific containers can be excluded without blocking resize actions for the rest of the pod.
- Default policy evaluation now includes KubeAI
Modelworkloads whenworkloadTypesis not set. - VPA-aware resize handling is more consistent across live workloads.
- Helm uninstall reliability for charts using rightsizing resources.
- GPU rightsizing and validation stability.
1.5.0 - June 23, 2026
1.5.0 - June 23, 2026
Updates and Improvements
Updates and Improvements
- KubeAI
Modelworkload support, including owner-scoped recommendation and rollback state handling. - KAI/vLLM tuning controls for GPU-sharing automation strategies.
- Default policy workload scope now includes KubeAI
Modelobjects whenworkloadTypesis omitted. - Rollback monitoring now enforces adoption-threshold behavior more consistently.
- Agentic Proposal sync remains opt-in through
GlobalConfigurationand is disabled by default.
- Helm uninstall reliability by aligning the pre-delete cleanup hook permissions with the rightsizing resources it patches.
1.4.0 - June 11, 2026
1.4.0 - June 11, 2026
Updates and Improvements
Updates and Improvements
- Initial formal release of the integration with the KAI scheduler for rightsizing fractional GPUs
- KAI documentation, examples, and release notes were updated for the
v1.4.0release
1.3.1 - June 09, 2026
1.3.1 - June 09, 2026
Updates and Improvements
Updates and Improvements
- Default policy evaluation now gives
RollbackPolicyandClusterRollbackPolicythe highest precedence.
1.3.0 - June 04, 2026
1.3.0 - June 04, 2026
Updates and Improvements
Updates and Improvements
- Introduced Rollback automation so clusters can now use the rollback state machine in live environments.
- Rollback owner/runtime handling and e2e fixtures were updated to support the new rollback flow.
- Live rollback e2e instability caused by synthetic state seeding.
1.2.0 - June 02, 2026
1.2.0 - June 02, 2026
Updates and Improvements
Updates and Improvements
- Webhook/client behavior improvements that make policy admission and reconciliation more resilient.
- Webhook reconciliation now uses informers/client behavior tuned for more reliable event handling.
- GPU-related e2e and policy behavior was refined for stability and consistency.
- Chart/docs content was updated to reflect the current release flow and user-facing guidance.
- Webhook error handling paths that could surface avoidable failures.
- Miscellaneous release-blocking regressions from the beta cycle.
1.1.0 - May 26, 2026
1.1.0 - May 26, 2026
Updates and Improvements
Updates and Improvements
- PodAffinityPolicy automation for supported workload types, including preferred node placement rules
- StrimziPodSet workload support for automating Strimzi-managed Kafka pods
- Prometheus scraping support for controller metrics with a chart-managed metrics service and optional ServiceMonitor
- Added experimental support for GPU sharing using the KAI scheduler
- GPU proactive policies can use
gpuOverallOptimalrecommendations from KAI for overall GPU optimization - Resize summaries now show when recommendations were clamped to configured resource bounds
1.0.0 - May 07, 2026
1.0.0 - May 07, 2026
Updates and Improvements
Updates and Improvements
- No customer-facing changes in this release.
0.4.0 - May 05, 2026
0.4.0 - May 05, 2026
Updates and Improvements
Updates and Improvements
- Namespace-level pause controls using the
rightsizing.kubex.ai/pause-untilannotation so automation can be paused across an entire namespace without annotating each pod individually
0.3.0 - May 01, 2026
0.3.0 - May 01, 2026
Updates and Improvements
Updates and Improvements
- Time-based automation scheduling with configurable windows including all-day support, overnight windows, and 24:00 explicit end time
- Policy snapshot uploads to Kubex gateway via automation-gateway with configurable intervals
- VPA resizing now requires active VPA recommendation conditions before allowing resize plans to prevent premature operations
- Stale owner recommendation cleanup flow for missing automation strategies
- Overlapping exclusion window handling by jumping to the latest end time
- Startup policy rescan now triggers automatically after readiness opens
0.2.1 - April 01, 2026
0.2.1 - April 01, 2026
Updates and Improvements
Updates and Improvements
- Configurable webhook probe pod settings via GlobalConfiguration including image selection
- ImagePullSecrets and securityContext support for enhanced security configuration
- GlobalConfiguration singleton enforcement via validating webhook to prevent multiple instances
- Case-insensitive HPA kind detection to match HPA targets regardless of casing
- Guaranteed QoS resize plan calculation to correctly normalize requests and limits
0.2.0 - March 01, 2026
0.2.0 - March 01, 2026
Updates and Improvements
Updates and Improvements
- Guaranteed QoS support with
retainGuaranteedQOSflag to enforce requests==limits constraint
- Webhook retry handling to properly manage too-many-requests scenarios
- Resize method preservation in retry scenarios to maintain consistency across retries
- Workload-to-policy namespace matching to ensure correct policy application
0.1.3 - February 01, 2026
0.1.3 - February 01, 2026
Updates and Improvements
Updates and Improvements
- Per-container enablement bounds to set different resource floor and ceiling limits for individual containers within a pod
- Webhook validation for inherited automation strategy bounds to ensure proper constraint enforcement
0.1.2 - January 15, 2026
0.1.2 - January 15, 2026
Updates and Improvements
Updates and Improvements
- Webhook validation for policy automation strategy references to ensure referential integrity
- Protection against deleting automation strategies that are actively referenced by policies
- ENABLE_WEBHOOKS flag parsing to correctly interpret as boolean value
0.1.1 - January 01, 2026
0.1.1 - January 01, 2026
Updates and Improvements
Updates and Improvements
- Rebranded from previous name to Kubex
- Workload-to-policy namespace matching to ensure policies are applied to correct workloads
Legacy Kubex Automation Controller Release Notes
1.0.13 - February 6, 2026 (Patch)
1.0.13 - February 6, 2026 (Patch)
Valkey Helm & OpenShift Compatibility Fixes
Valkey Helm & OpenShift Compatibility Fixes
- Provided complete security contexts to resolve Helm
coalesce.go:298warnings forvalkey.podSecurityContextandvalkey.securityContext. - Added initContainer resource requests/limits to satisfy OpenShift admission requirements.
- Removed fixed UIDs/GIDs from valkey for OpenShift SCC compatibility.
VPA Exclusion to Prevent Autoscaler Conflicts
VPA Exclusion to Prevent Autoscaler Conflicts
- Automatic VerticalPodAutoscaler (VPA) detection and exclusion to prevent Kubex Automation from competing with VPA for resource management.
- Prevents conflicts between VPA and Kubex automation.
1.0.12 - January 28, 2026 (Patch)
1.0.12 - January 28, 2026 (Patch)
OpenShift anyuid Requirement Removed
OpenShift anyuid Requirement Removed
- Removed OpenShift SCC rolebinding configuration—no longer requires
anyuidfor Kubex Automation Controller.
1.0.11 - January 27, 2026 (Patch)
1.0.11 - January 27, 2026 (Patch)
OpenShift Support & Valkey Storage Update
OpenShift Support & Valkey Storage Update
- Added OpenShift support for Kubex Automation Controller.
- Removed default valkey storage settings—now ephemeral by default.
1.0.10 - January 22, 2026 (Patch)
1.0.10 - January 22, 2026 (Patch)
Service Account Metadata & Logging Improvements
Service Account Metadata & Logging Improvements
- Human-readable timestamps for automation logs—All automation logs now use clear, human-readable timestamps, improving readability, troubleshooting, and auditability.
- Support for user-defined metadata on service accounts—Users can now attach additional, custom metadata to service accounts.
1.0.9 - December 19, 2025 (Minor)
1.0.9 - December 19, 2025 (Minor)
Simplified Certificate Management
Simplified Certificate Management
- Easier Installation—Reduced deployment complexity and external dependencies by no longer requiring cert-manager by default.
- Flexible Options—Continue to choose from self-signed certificates, cert-manager integration, or bring-your-own-certificate based on your environment requirements.
Performance Enhancements
Performance Enhancements
Enhanced Visibility
Enhanced Visibility
1.0.8 - December 12, 2025 (Patch)
1.0.8 - December 12, 2025 (Patch)
Configurable Wait-for-Valkey Image
Configurable Wait-for-Valkey Image
- Private Registry Support—Organizations that cannot pull images from public repositories can now configure the automation controller to use images hosted in their private registries.
- Image Location Override—The
waitForValkeyImageconfiguration option allows specifying a custom image location (default:busybox:latest), enabling deployment in air-gapped or restricted network environments. - Flexible Deployment—This enhancement ensures the automation controller can be deployed in security-hardened environments where all container images must be sourced from approved internal registries.
1.0.7 - December 11, 2025 (Major)
1.0.7 - December 11, 2025 (Major)
In-Place Pod Resizing Support
In-Place Pod Resizing Support
- Zero-Downtime Resizing—Containers are resized in-place without eviction when supported by the cluster, ensuring continuous availability for critical workloads.
- Automatic Fallback—For clusters that don’t support in-place resizing or workloads that require pod recreation, the controller automatically falls back to the traditional pod eviction method.
- Kubernetes 1.33+ Required—In-place resizing requires Kubernetes 1.33 or later with the InPlacePodVerticalScaling feature gate enabled.
Enhanced Logging and Action Visibility
Enhanced Logging and Action Visibility
- RESIZED—Pod was successfully resized using in-place resizing (zero downtime).
- EVICTED—Pod was evicted and recreated with new resource specifications (traditional method).
- BLOCKED—Pod could not be resized, with detailed blocking reasons explaining why (e.g.,
hpa_conflict_cpu,limit_range_violation,resource_quota_exceeded,node_size_insufficient,manual_pause_infinite). - SKIPPED—Pod is already sized at the recommended specification, no action needed.
Annotation-Based Automation Control
Annotation-Based Automation Control
rightsizing.kubex.ai/pause-until: "<RFC3339 timestamp | infinite>" annotation:- Learning Periods—Pause automation temporarily after application changes or deployments to allow the system to gather sufficient metrics before optimizing. Specify an RFC3339 timestamp to pause until a specific date.
- Permanent Exclusions—Permanently exclude specific workloads from automation by setting the annotation value to
infinite, providing granular control over which resources are managed by Kubex.
cluster-autoscaler.kubernetes.io/safe-to-evict=false annotation, ensuring that pods marked as unsafe to evict are never evicted by the automation controller, even when optimization recommendations are available.This annotation-based approach integrates seamlessly with GitOps workflows and provides declarative control over automation scope. See Pausing Automation for Specific Pods for detailed usage examples.Simplified Scope Configuration
Simplified Scope Configuration
podLabels field in the Helm values scope configuration is now optional, simplifying deployment for users who want to enable automation across entire namespaces without label-based filtering.- Previously,
podLabelswas mandatory and required explicit configuration even when not needed. - Now, you can define scope using only
namespacefor namespace-wide automation, or combinenamespacewith optionalpodLabelsfor more granular control.
Optimized Startup and Scan Intervals
Optimized Startup and Scan Intervals
- Quick Initial Scan—The first scan now executes 2 minutes after controller startup (default), allowing rapid initialization and faster time-to-value.
- Configurable Regular Interval—Subsequent scans run at the configured interval, providing predictable automation cadence.
- Reduced Startup Delay—Previously, users had to wait for the full scan interval before the first automation actions occurred.
Infrastructure and Stability Improvements
Infrastructure and Stability Improvements
- Increased API Timeout—API timeout values have been increased to handle slower Kubex API responses during peak loads, preventing unnecessary automation failures.
- Updated cert-manager Dependency—The cert-manager version has been updated to the latest stable release, ensuring compatibility with modern Kubernetes clusters and improving certificate management reliability.
1.0.6 - December 9, 2025 (Patch)
1.0.6 - December 9, 2025 (Patch)
Webhook Configuration Optimization
Webhook Configuration Optimization
- Reduced Webhook Invocations—The mutating admission controller now only intercepts pod creation events, eliminating unnecessary processing during pod updates.
- Improved Cluster Performance—Reducing webhook triggers decreases API server load and improves overall cluster responsiveness.
1.0.5 - November 28, 2025 (Patch)
1.0.5 - November 28, 2025 (Patch)
In-Place Resizing RBAC Support
In-Place Resizing RBAC Support
- Future Feature Preparation—RBAC rules have been added to grant the controller the necessary permissions to perform in-place pod resource updates when the feature becomes generally available.
- No Functional Changes—This release focuses on infrastructure readiness; the in-place resizing feature itself was introduced in version 1.0.7.
1.0.4 - November 4, 2025 (Minor)
1.0.4 - November 4, 2025 (Minor)
External Secret Management Support
External Secret Management Support
- External Secrets Integration—The Helm chart now supports working with secrets created and managed by external secret management tools (e.g., External Secrets Operator, Sealed Secrets), rather than requiring the chart to create secrets internally.
- Enhanced Security Posture—Organizations can now leverage their existing secret management workflows and tools, ensuring secrets are handled according to enterprise security policies and compliance requirements.
- Customer-Driven Enhancement—This feature was developed based on customer feedback to support real-world enterprise deployment scenarios where centralized secret management is required.
Flexible Namespace Deployment
Flexible Namespace Deployment
- Arbitrary Namespace Support—The Helm chart can now be deployed in any namespace, not just predefined ones, providing greater flexibility for multi-tenant environments and organizational policies.
- Improved Secret Management—Namespace flexibility complements external secret management by allowing secrets to reside in different namespaces according to security boundaries and access control requirements.
- Simplified Multi-Cluster Deployments—Organizations with standardized namespace naming conventions can now deploy the controller consistently across multiple clusters without chart modifications.
1.0.3 - October 31, 2025 (Patch)
1.0.3 - October 31, 2025 (Patch)
Environment Variable Enhancements
Environment Variable Enhancements
- Namespace Context—Environment variables now include the release namespace, enabling better multi-namespace deployments and troubleshooting.
- Improved Configuration—Simplifies configuration in multi-tenant environments where multiple instances of the controller run in different namespaces.
1.0.2 - October 21, 2025 (Major)
1.0.2 - October 21, 2025 (Major)
Valkey Integration for Recommendation Storage
Valkey Integration for Recommendation Storage
- Simplified Deployment—Eliminates the need for persistent storage configuration, reducing deployment complexity and storage management overhead.
- Improved Performance—Valkey provides fast in-memory data access for recommendation retrieval, improving controller response times.
- Enhanced Scalability—In-memory storage enables better horizontal scaling capabilities for large-scale deployments.
Automated Pod Eviction and Resizing
Automated Pod Eviction and Resizing
- Automated Pod Scanning—The controller continuously scans all pods within the configured scope, evaluating them for optimization opportunities based on Kubex recommendations.
- Pre-Eviction Safety Checks—Before resizing any pod, the controller runs a comprehensive series of checks to ensure safe eviction, including:
- Validation of workload owner types and controller compatibility
- HPA (Horizontal Pod Autoscaler) conflict detection
- Resource quota and limit range compliance
- Pod disruption budget (PDB) verification
- Policy specification compliance to verify automation is allowed
- Intelligent Pod Eviction—When a pod passes all safety checks, the controller performs controlled eviction, allowing the mutating admission controller to automatically apply optimized resource specifications when the pod is recreated.
- Scope-Based Control—Administrators define automation scope through Helm values, specifying namespaces and optional pod labels to control which workloads are managed by the automation controller.
1.0.1 - August 22, 2025 (Patch)
1.0.1 - August 22, 2025 (Patch)
Security and Infrastructure Improvements
Security and Infrastructure Improvements
- Gateway Resource Management—Added resource requests and limits for the gateway container, ensuring predictable resource allocation and preventing resource contention in production environments.
- Enhanced Secret Security—Improved secret handling by switching from environment variables to volume mounts, reducing the risk of secret exposure through process listings and container inspection.
- Automated CA Bundle Management—The webhook configuration now automatically extracts the CA bundle from TLS secrets, eliminating the need for manual CA bundle configuration and reducing deployment complexity.
- Simplified Configuration—Removed the manual
caBundledependency fromvalues-edit.yaml, streamlining the Helm chart configuration process. - Improved Documentation—Enhanced certificate generation documentation with detailed examples for multiple certificate creation methods, including OpenSSL, CFSSL, and Bring Your Own Certificate (BYOC) scenarios.
1.0.0 - June 25, 2025 (Major)
1.0.0 - June 25, 2025 (Major)
Initial Kubex Automation Controller Release
Initial Kubex Automation Controller Release
- Helm Chart Deployment—Packaged as a Helm release for simplified installation and management.
- Automated Setup Script—Quick deployment script automates setup, including cert-manager installation.
- Split Architecture—Redesigned with separate containers for core webhook logic and secure API communication.
Security and Control Features
Security and Control Features
- Enhanced Security—Encrypted credentials, non-root container execution, and seccomp profiles enabled by default.
- Selective Automation—Ability to include or exclude specific workload types (e.g., Deployment, StatefulSet) from automation.
- Offline Resilience—Mutations are cached locally during connectivity issues and synchronized when connection is restored.