> ## Documentation Index
> Fetch the complete documentation index at: https://docs.kubex.ai/llms.txt
> Use this file to discover all available pages before exploring further.

# Visualizing Your Data

export const InlineImageWithText = ({src, href, children, width = 80, caption}) => {
  return <span className="inline-flex items-center gap-3 align-middle">
            <a href={href} className="inline-block border-b-0">
                <Frame caption={caption}>
                    <img src={src} alt="" className="object-contain align-middle " width={width} style={{
    minWidth: width
  }} />
                </Frame>
            </a>
            <span className="align-middle">{children}</span>
        </span>;
};

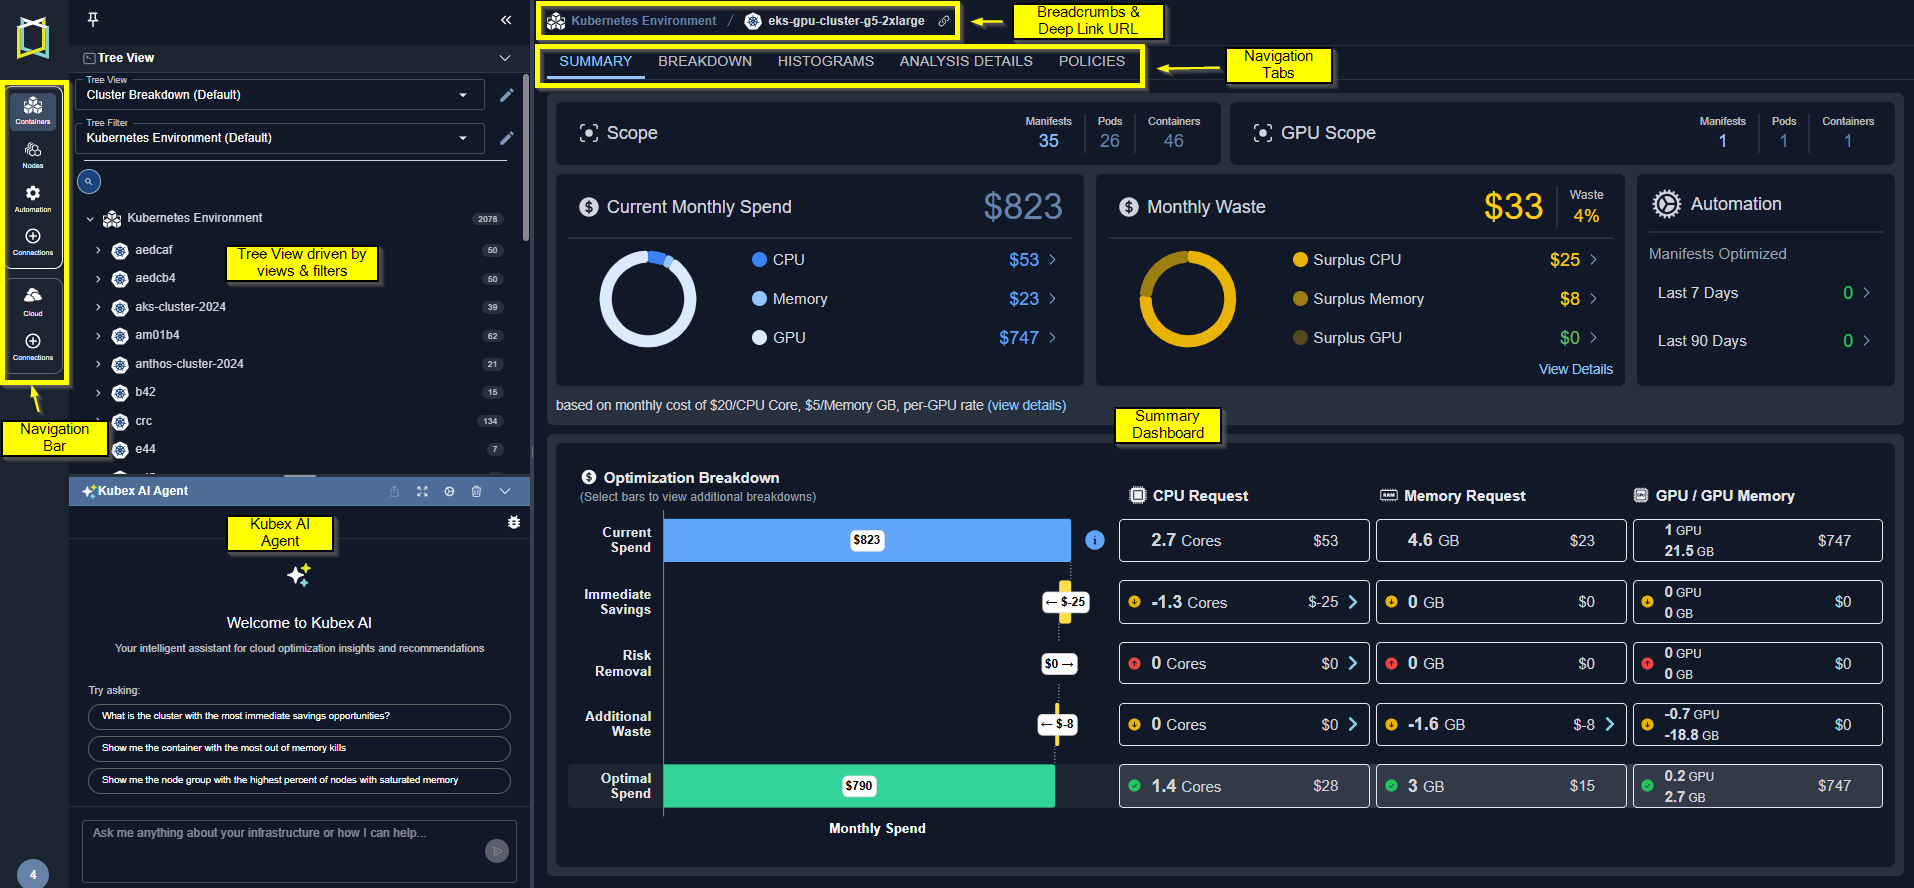
<Frame caption="Figure: Kubex User Interface">
  <img src="https://mintcdn.com/densify/2yB5CeopMETTG0GR/images/docs-kubex/k8s_visualizingdata.png?fit=max&auto=format&n=2yB5CeopMETTG0GR&q=85&s=ab857942888a25e390f343863d3fa82b" alt="" width="1914" height="888" data-path="images/docs-kubex/k8s_visualizingdata.png" />
</Frame>

## Navigation Bar

Select Containers or Public Cloud from the navigation bar on the left side of the screen.

<InlineImageWithText src="/images/docs-kubex/Content/Kubex/03000198.png">
  Four options are provided to view, monitor and manage the various components of your Kubernetes environments:

  <ul>
    <li>
      Kubex provides a simple yet powerful interface to optimize your container environments. Use the <a href="/docs-kubex/Content/Kubex/Using_the_Tree_Viewer"> tree viewer </a> to navigate and explore your Kubernetes clusters.
    </li>

    <li>
      Kubex analyzes and then provides visibility to the health of your node groups, including risks that are impacting the stability of the containers they are hosting. Use the <a href="/docs-kubex/Content/Kubex/Using_the_Node_Tree_Viewer"> node tree viewer </a> to navigate and explore node groups.
    </li>

    <li>
      The automation features allow you to optimize your Kubernetes pods based on Kubex recommendations, ensuring resources are effectively allocated for improved performance and cost efficiency. See the <a href="/docs-kubex/Content/Kubex/Automation_Tab"> Automation </a> tab.
    </li>

    <li>
      You can monitor the status of data collection for your clusters from this page. Click the icon to open the <a href="/docs-kubex/Content/Kubex/Data_Collection_Overview"> Connections </a> page.
    </li>
  </ul>
</InlineImageWithText>

<InlineImageWithText src="/images/docs-kubex/Content/Kubex/03000201_93x220.png">
  Two options are provided to view, monitor and manage your public cloud environments:

  <ul>
    <li>
      Kubex helps with optimiziting your cloud environments. Use the <a href="/docs-kubex/Content/Cloudex/Using_the_Cloud_Tree_Viewer"> cloud tree viewer </a> to navigate and explore your public cloud environment.
    </li>

    <li>
      You can monitor the status of data collection for your cloud environments from this page. Click the icon to open the <a href="/docs-kubex/Content/Cloudex/Cloud_Connections"> Connections </a> page.
    </li>
  </ul>
</InlineImageWithText>

## Tree Viewer

Kubex provides a tree viewer for navigating through your environments efficiently. The tree viewer provides an intuitive and structured approach, organizing data hierarchically, allowing you to expand or collapse branches to review information without being overwhelmed.

<br />

Additionally, search functionality, customizable views and filters further enhance usability, making data navigation more efficient.

<InlineImageWithText href="/docs-kubex/Content/Cloudex/Using_the_Cloud_Tree_Viewer" src="/images/docs-kubex/Content/Kubex/03000171.png">
  The <a href="/docs-kubex/Content/Cloudex/Using_the_Cloud_Tree_Viewer">cloud tree viewer</a> allows you to navigate your public cloud environments.
</InlineImageWithText>

<InlineImageWithText href="/docs-kubex/Content/Kubex/Using_the_Tree_Viewer" src="/images/docs-kubex/Content/Kubex/03000004.png">
  The <a href="/docs-kubex/Content/Kubex/Using_the_Tree_Viewer">container tree viewer</a> allows you to navigate and explore your Kubernetes environments.
</InlineImageWithText>

<InlineImageWithText href="/docs-kubex/Content/Kubex/Using_the_Node_Tree_Viewer" src="/images/docs-kubex/Content/Kubex/03000092.png">
  The <a href="/docs-kubex/Content/Kubex/Using_the_Node_Tree_Viewer">node tree viewer</a> allows you to  navigate and explore node groups down to the individual nodes.
</InlineImageWithText>

## Changing the View Mode

<InlineImageWithText src="/images/docs-kubex/Content/Kubex/03000010.png">
  You can view the interface in dark or light mode using the switch in the lower left corner.
</InlineImageWithText>

## Using Deep Links

These links reference a specific page within Kubex, rather than simply linking to the home page or a top-level summary page.

You can copy and send a link to another user from any page at any tree viewer level or with a specific instance selected. The recipient can then use the link to view the same page, or instance details in their view of Kubex.

Figure: Deep Links

<Frame>
  <img src="https://mintcdn.com/densify/JV3F9NQeWJDSttAM/images/docs-kubex/Content/Kubex/03000212.png?fit=max&auto=format&n=JV3F9NQeWJDSttAM&q=85&s=b00a0299f14d11435dbfc0e3a5362b5d" alt="" width="764" height="143" data-path="images/docs-kubex/Content/Kubex/03000212.png" />
</Frame>

Deep links are also provided when you [export](/docs-kubex/Content/Kubex/Using_Table_Column_Features#export) the [Analysis Details Table](/docs-kubex/Content/Kubex/AI_Analysis_Details_Table) page.
The recipient must have valid Kubex credentials.

## Navigating using the Breadcrumbs

The current navigation path to the currently displayed selection, is shown at the top of the page. Click on any part of the path to return to that level.

This path is determined by the selected tree view and will update as you make selections in the tree viewer or on the page.

<Frame caption="Figure: Breadcrumbs">
  <img src="https://mintcdn.com/densify/zZdJaPjmZYmfrfqT/images/docs-kubex/Content/Kubex/03000086_601x48.png?fit=max&auto=format&n=zZdJaPjmZYmfrfqT&q=85&s=1445cb4b01d77f6eee6a272784017bf8" alt="" width="601" height="48" data-path="images/docs-kubex/Content/Kubex/03000086_601x48.png" />
</Frame>

## Viewing the Summary Banner

Key metrics are displayed in a banner at the top of most pages. These values, specifically estimated waste, give you a quick indication that the selected environment needs further investigation.

### Containers Summary Banner

<Frame caption="Figure: Containers Summary Banner">
  <img src="https://mintcdn.com/densify/TpLX2DER6ESzxW4b/images/docs-kubex/Content/Kubex/03000003.png?fit=max&auto=format&n=TpLX2DER6ESzxW4b&q=85&s=044d6631710049a10ed7d2f40fc9fb4f" alt="" width="724" height="62" data-path="images/docs-kubex/Content/Kubex/03000003.png" />
</Frame>

<Accordion title="Table: Containers Summary Banner">
  <table>
    <thead>
      <tr>
        <th>
          Column Name
        </th>

        <th>
          Description
        </th>
      </tr>
    </thead>

    <tbody>
      <tr>
        <td>
          Average No. Containers (Manifests)
        </td>

        <td>
          The average number of containers, on which the report is based. The number of manifests is also displayed.
          If you have applied filters at the tree view level, the totals, displayed in this summary, reflect the defined filters.
          Filters defined on the page do not affect this value.
        </td>
      </tr>

      <tr>
        <td>
          Efficient Rating
        </td>

        <td>
          The Efficiency Rating provides an indication of the health of your aggregated environment. The value is indicated in red, when it is greater than 1.

          <ul>
            <li>A value of 1 indicates that, at an aggregate level, the environment is efficient according to the defined policy settings.</li>
            <li>A value less than 1 indicates potential savings opportunities due to over-allocated resources.</li>
            <li>A value greater than 1 indicates potential risks due to under-allocated resources. The value is indicated in red, when it is greater than 1.</li>
          </ul>
        </td>
      </tr>

      <tr>
        <td>
          Estimated Waste
        </td>

        <td>
          The estimated monthly savings for the selected scope of systems. 
          The estimated cost savings are calculated by converting the CPU and memory surplus into hardware savings based on the cost of the surplus CPU cores and GB of memory.
          The cost per core and per GB of memory is configurable. Contact <a href="mailto:Support@kubex.ai">[Support@kubex.ai](mailto:Support@kubex.ai)</a> for details.
        </td>
      </tr>

      <tr>
        <td>
          Surplus CPU Request (mCores)
        </td>

        <td rowspan="2" style={{verticalAlign: 'middle'}}>
          This is the aggregated total CPU | Memory Request Surplus in mCores or MB.
          This is calculated as (Current CPU or Memory Request - Recommended CPU or Memory Request) \* Current Count) of the filtered list.
          Containers with unspecified CPU | Memory Requests are excluded from these metrics.
        </td>
      </tr>

      <tr>
        <td>
          Surplus Memory Request (MB)
        </td>
      </tr>
    </tbody>
  </table>
</Accordion>

## Using the Navigation Tabs

Kubex offers multiple tabs that allow you to analyze and explore your data from different perspectives.

Based on your selection in the tree viewer various tabs are displayed to view the selected data. When multiple systems are selected you see:

<ul>
  <li>
    <a href="/docs-kubex/Content/Kubex/Summary_Tab"> Summary </a>

    * Shows you summary of how effectively your resources are being utilized.
  </li>

  <li>
    <a href="/docs-kubex/Content/Kubex/Breakdown_Tab"> Breakdown </a>

    * Shows you a breakdown of the items, selected in the tree view, providing a high-level comparison.
  </li>

  <li>
    <a href="/docs-kubex/Content/Kubex/Histograms_Tab"> Histograms </a>

    * Shows you the selected scope of your environment as set of histograms.
  </li>

  <li>
    <a href="/docs-kubex/Content/Kubex/AI_Analysis_Details_Tab"> Analysis Details </a>

    * Shows analysis details of the selected scope of your environment in various tabular views with utilization charts for selected systems.
  </li>

  <li>
    <a href="/docs-kubex/Content/Kubex/Policies_Tab"> Policies </a>

    * Shows you details of the policy that was used to generate your analysis results.
  </li>
</ul>

When a single container is selected you see:

<ul>
  <li>
    <a href="/docs-kubex/Content/Kubex/Overview_Tab"> Overview </a>

    * Shows you the utilization and recommendation details for the selected container.
  </li>

  <li>
    <a href="/docs-kubex/Content/Kubex/GPU_Tab"> GPU </a>

    * Shows you the utilization details for the selected GPU instance.
  </li>

  <li>
    <a href="/docs-kubex/Content/Kubex/Metrics_Viewer_Tab"> Metrics Viewer </a>

    * Shows you collected and analyzed data for a specific container.
  </li>
</ul>

#### Video Resources

<AccordionGroup>
  <Accordion title="Chart Selection Controls">
    <iframe frameborder="0" height="310" src="https://player.vimeo.com/video/1054628370?badge=0&autopause=0&player_id=0&app_id=58479" width="550" />

    <a href="https://player.vimeo.com/video/1054628370?badge=0&autopause=0&player_id=0&app_id=58479" target="_blank">Using the Chart Selection Controls</a>
  </Accordion>

  <Accordion title="Kubex UI Overview">
    <iframe frameborder="0" height="310" src="https://player.vimeo.com/video/1052046936?badge=0&autopause=0&player_id=0&app_id=58479" width="550" />

    <a href="https://player.vimeo.com/video/1052046936?badge=0&autopause=0&player_id=0&app_id=58479" target="_blank">Kubex UI Overview</a>
  </Accordion>

  <Accordion title="Searching for a System">
    <iframe frameborder="0" height="310" src="https://player.vimeo.com/video/1044765242?badge=0&autopause=0&player_id=0&app_id=58479" width="550" />

    <a href="https://player.vimeo.com/video/1044765242?badge=0&autopause=0&player_id=0&app_id=58479" target="_blank">Searching for a System</a>
  </Accordion>

  <Accordion title="Setting Filters in Columns">
    <iframe frameborder="0" height="310" src="https://player.vimeo.com/video/1039085173?title=0&byline=0&portrait=0&badge=0&autopause=0&player_id=0&app_id=58479" width="550" />

    <a href="https://player.vimeo.com/video/1039085173?title=0&byline=0&portrait=0&badge=0&autopause=0&player_id=0&app_id=58479" target="_blank">Setting Filters in Columns</a>
  </Accordion>

  <Accordion title="Using Histograms">
    <iframe frameborder="0" height="310" src="https://player.vimeo.com/video/1039069463?title=0&byline=0&portrait=0&badge=0&autopause=0&player_id=0&app_id=58479" width="550" />

    <a href="https://player.vimeo.com/video/1039069463?title=0&byline=0&portrait=0&badge=0&autopause=0&player_id=0&app_id=58479" target="_blank">Using the Histograms</a>
  </Accordion>

  <Accordion title="Using the Tree Viewer">
    <iframe frameborder="0" height="310" src="https://player.vimeo.com/video/1038945637?title=0&byline=0&portrait=0&badge=0&autopause=0&player_id=0&app_id=58479" width="550" />

    <a href="https://player.vimeo.com/video/1038945637?title=0&byline=0&portrait=0&badge=0&autopause=0&player_id=0&app_id=58479" target="_blank">Using the Tree Viewer</a>
  </Accordion>

  <Accordion title="Using the Utilization Charts">
    <iframe frameborder="0" height="310" src="https://player.vimeo.com/video/1042992591?badge=0&autopause=0&player_id=0&app_id=58479" width="550" />

    <a href="https://player.vimeo.com/video/1042992591?badge=0&autopause=0&player_id=0&app_id=58479" target="_blank">Using the Utilization Charts</a>
  </Accordion>
</AccordionGroup>