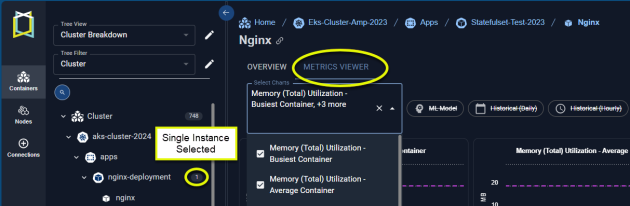
- Select one container to review. The metrics viewer tab is not displayed until only one container is selected.
- Use the tree viewer’s search feature to find a specific container. Enter the name of the container, as you type, matching items are displayed in the list.
- Ensure the view and filter settings are set accordingly, to locate your specific container.
Metrics Viewer Controls
When you open the metrics viewer, the instance that was selected in the Instance Optimization Details page is displayed. You can from the tree viewer, or from the Analysis Details tab. You can configure the data you want to view for this container using the options in the dropdown menus.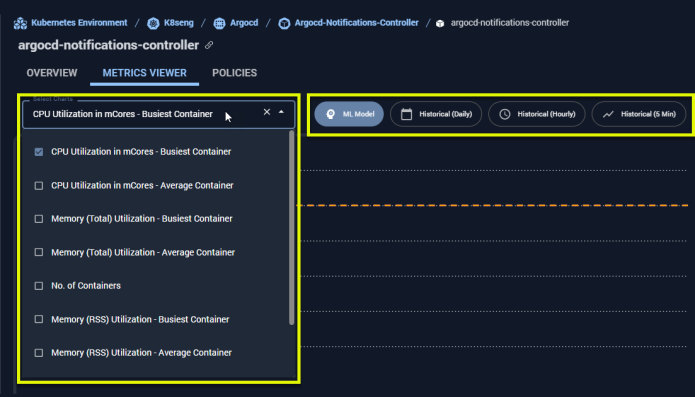
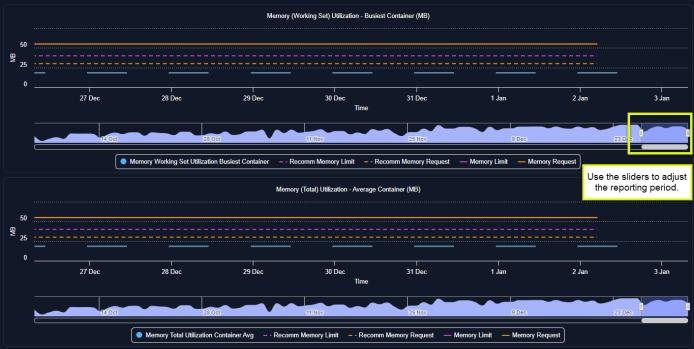
Table: Metrics Viewer Controls
Table: Metrics Viewer Controls
| Setting | Description |
|---|---|
| Select Charts | Select the number of charts to display from the drop down list. You can view all 9 different metrics for the selected container. Scroll bars are provided as required to navigate the displayed charts. |
| Period | Figure: Metrics Viewer Controls 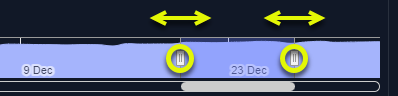 Using the slider along the bottom of the page, select the period on which you want to report. The available time range depends on the type of report selected for display. Historical daily and hourly reports can provide up to 90 days of historical data.
The slider is not required for the ML Model view that only shows the last 24 hours of data. Using the slider along the bottom of the page, select the period on which you want to report. The available time range depends on the type of report selected for display. Historical daily and hourly reports can provide up to 90 days of historical data.
The slider is not required for the ML Model view that only shows the last 24 hours of data.Note: Kubex retains up to 3 months of historical data for the metrics viewer. When creating a customized period, you cannot view data older than 90 days. |
| View By | Figure: Metrics Viewer Chart Options
|
- The line chart shows the selected metric plotted by the hour or date.
- The X-axis scales based on the amount of data up to the maximum of 90-days. The X-axis will show both date and hour when the date range includes less than 7-days. Only the date is shown when there are more than 7-days of data on the chart.
- If you hover over any data point in the graph a popup indicates the values on the selected date. You can slide the mouse along the plotted lines to see data values at the specific date or time.
- If metric data is not available, the message “NA” is shown in the legend of the impacted chart.
Available Container Metrics
The following table lists the complete set of metrics that you can review in the metrics viewer.Table: Container Metrics
Table: Container Metrics
| Metrics | Units |
|---|---|
| CPU Limit - Current | mCores |
| CPU Limit - Recommended | mCores |
| CPU Request - Current | mCores |
| CPU Request - Recommended | mCores |
| CPU Utilization - Busiest Container | mCores |
| CPU Utilization - Container Average | mCores |
| Disk I/O - Busiest Container * | Kbytes/s |
| Memory (RSS) Utilization - Busiest Container | MB |
| Memory (RSS) Utilization - Container Average | MB |
| Memory (Total) Utilization - Busiest Container | MB |
| Memory (Total) Utilization - Container Average | MB |
| Memory (Working Set) Utilization - Busiest Container | MB |
| Memory (Working Set) Utilization - Container Average | MB |
| Memory Limit - Current | MB |
| Memory Limit - Recommended | MB |
| Memory Request - Current | MB |
| Memory Request - Recommended | MB |
| No. of Containers | Number |
| No. of Restarts | Number |