Cluster Filter
The Cluster Filter on the left side panel allows users to select which clusters are included in the dashboard. By default all clusters are included.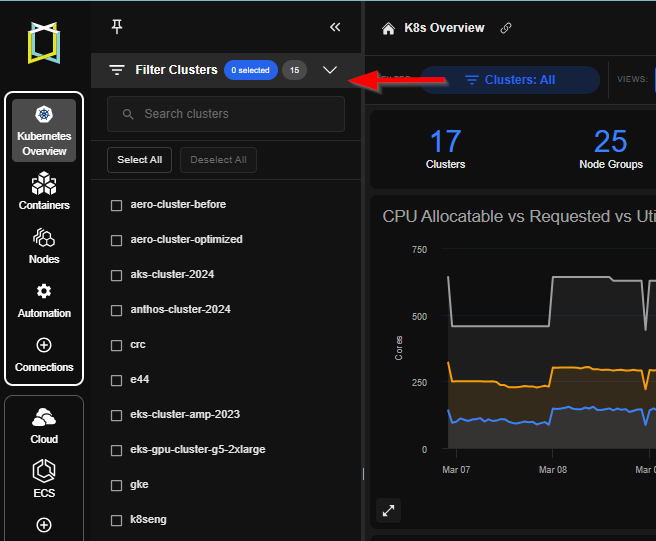
- Search for clusters
- Select one or multiple clusters
- Select all or deselect all clusters
- Apply or reset filters
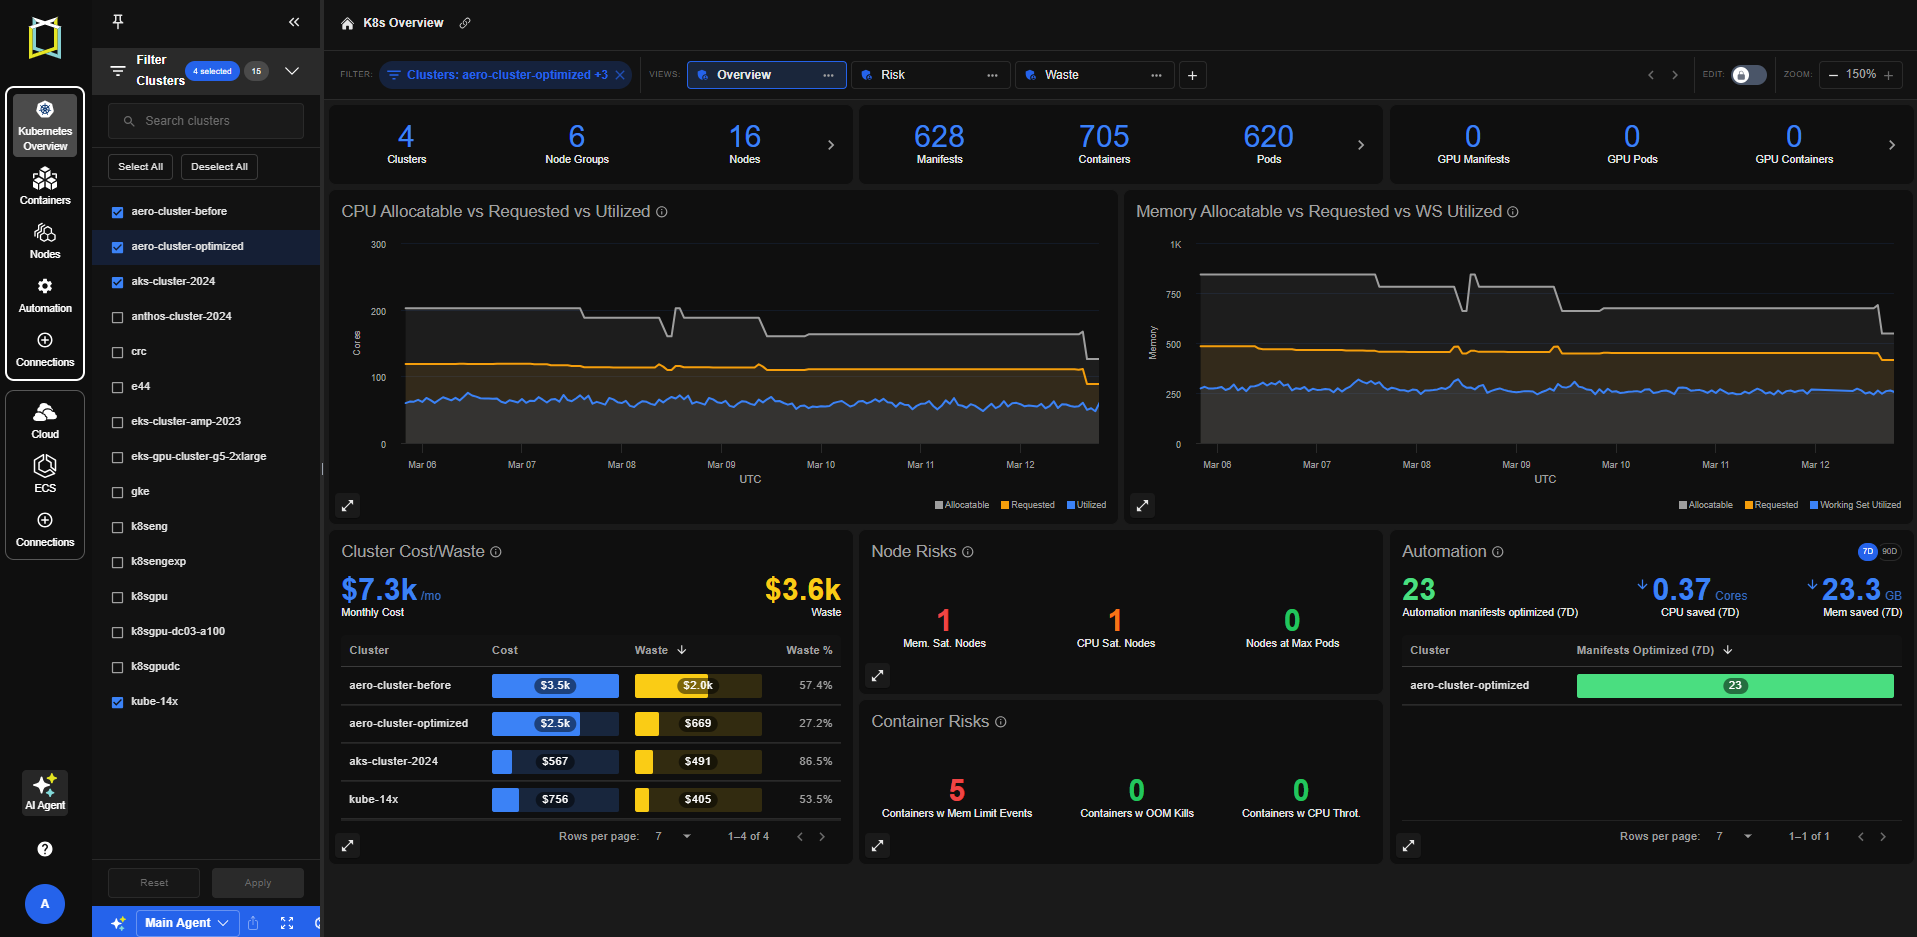
Dashboard Views
Users can switch between multiple system views that are available out of the box:
- Overview – High-level usage, cost and risk insights
- Waste – Focus on resource inefficiency and cost waste
- Risk – Focus on Node and Cluster performance and resource risks
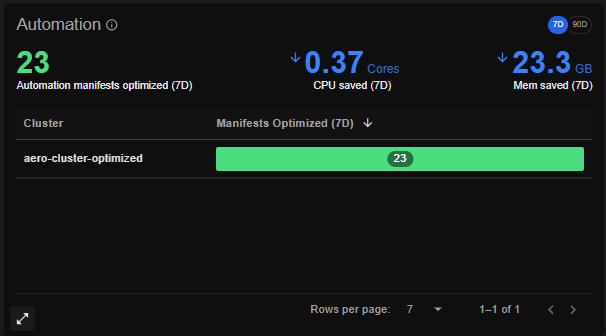
Key widgets
CPU Allocatable vs Requested vs Utilized This chart compares the allocatable CPU/Memory with what is being requested and the actual usage over time.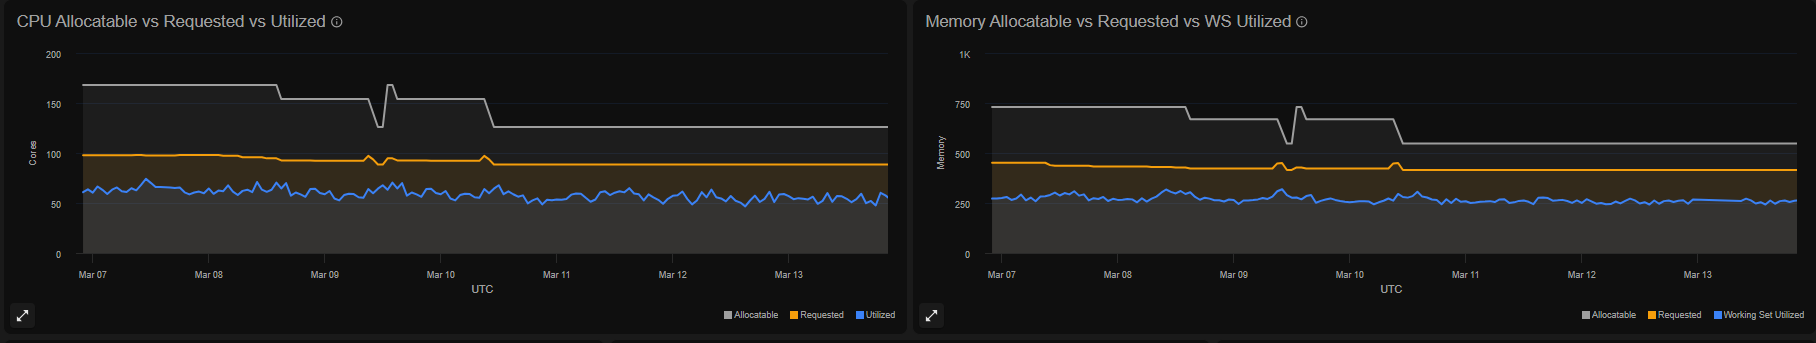
- If Utilized is much lower than Requested, workloads may be over-provisioned.
- Large gaps between Allocatable and Requested may indicate unused capacity due to other factors (like max pods/node or ephemeral storage constraints) that makes the node autoscaler spin up more nodes.
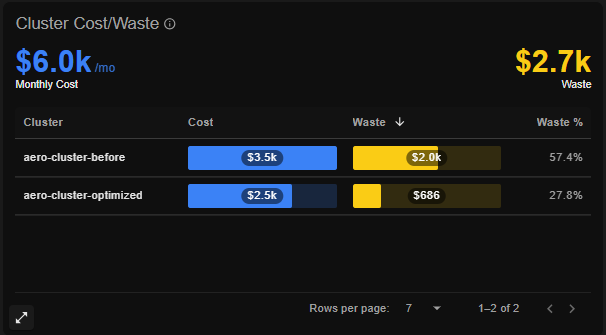
- Monthly Cost – Total estimated monthly cost of the cluster
- Waste – Estimated cost of unused or over-provisioned resources
- Waste % – Percentage of cluster cost that is inefficiently used
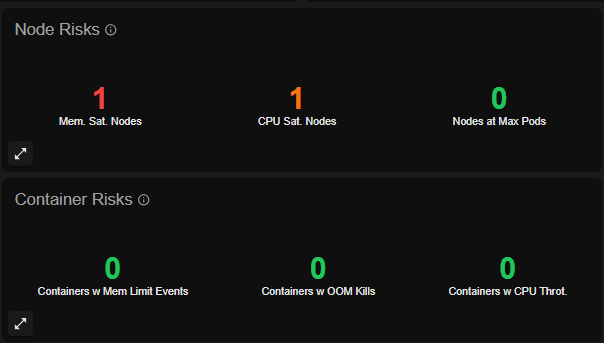
- Memory Saturated Nodes: # of Nodes experiencing very high memory usage in the last 7 days
- CPU Saturated Nodes: # of Nodes experiencing very high CPU usage in the last 7 days
- Nodes at Max Pods: # of Nodes that have reached the maximum allowed number of pods in the last 7 days
- Containers with Memory Limit Events: # of Containers where the working set utilization is at or very close to the Memory limit in the last 7 days
- Containers with Kill Events: Containers terminated due to a kill event (SIGKILL)
- Containers with CPU Throttling: Containers experiencing CPU throttling